Have you ever built a form in Hyperion Planning (or PBCS) that really needed to have the same dimension represented in both the user selectable page and the rows or columns? Normally, we want to give the user the ability to filter a form dynamically. As an example, perhaps I would like to select and upper level parent of a product in the page, but I want to see all of the descendants of that selection in the rows of a
form. As another example, I’d like to select an upper-level cost center in the page, but have it show me all of the descendents of that selection in the rows of the form. I recently encountered that very request from a client. As it happens, I recently had a request come in via a comment on this site as well.
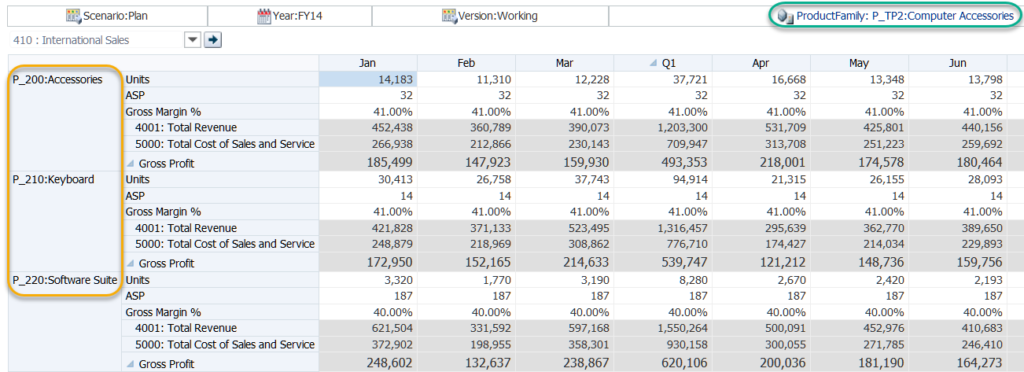
So how can we do this? I know how to build forms, and a dimension can only be part of the POV, the page, rows, or columns, right? If we look at the form designer, that’s totally how it seems. This is where the form designer is a bit deceiving. Let’s start with a cool screen shot:

If we look at the green box in the top right corner, we have the product dimension. If we look at the yellow box on the left…we have the product dimension. So what happens if I click on green box?

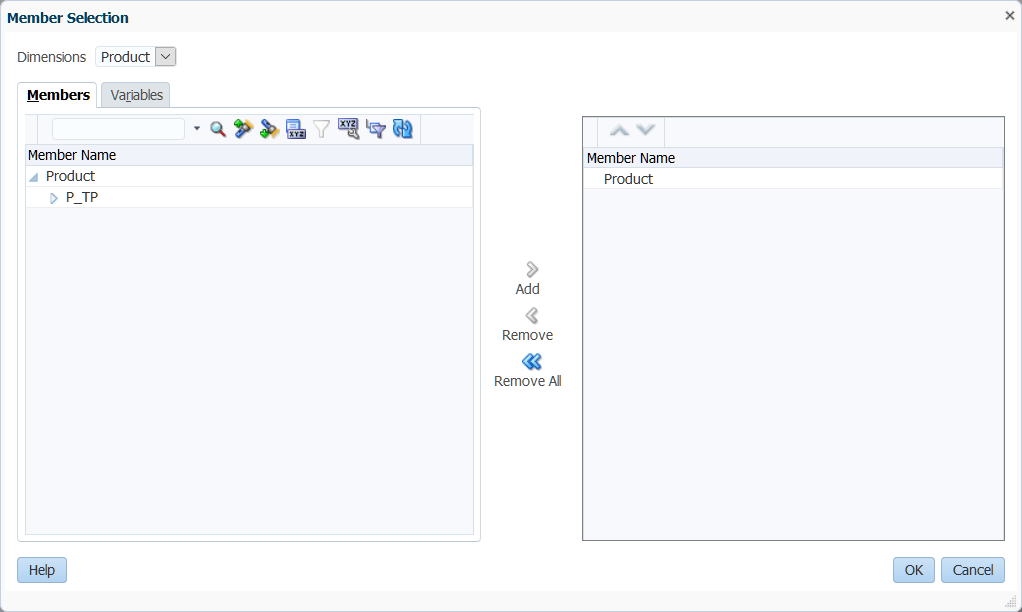
Look at that! It’s not quite as cool as a drop-down in the page, but it still let’s us select a member from the product dimension. Now let’s take a look at the form designer:

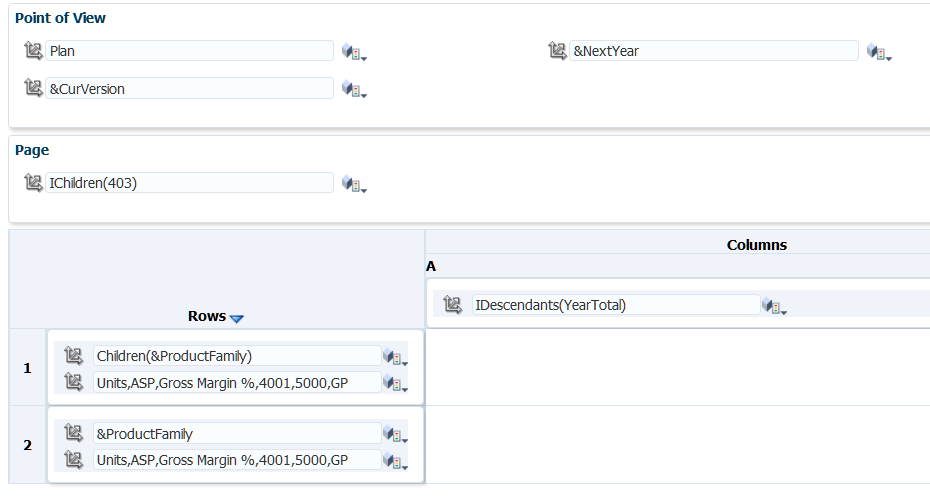
Looking closely, we’ll notice that the product dimension only exists in one place in the designer…the rows. But wait, we should make note of one other thing: the ProductFamily variable. This is not a substitution variable. This is instead a dynamic user variable. Let’s check out the Other Options tab:

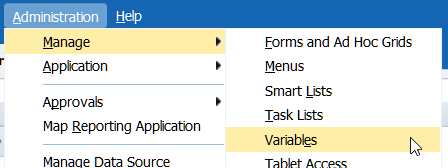
There’s the magic! We have a dynamic user variable added to our form. This automatically places the member in the POV, but enables a member selector. So there you have it, a super-simple provide a solution to a complex user request. So how do I create a dynamic user variable? Click Administration, then click Manage, then click Variables:

From here, you can easily add your user variables. The only real downside to the method is that if the users don’t have the variable defined yet, it will let them know that they need to before allowing them to open the form. This looks great in the web, but what happens when I try it in Smart View?

It still works! Let’s be honest, you have to check these things in Smart View because we just never really know. That’s all for a quick post on a neat feature that I’ve found to be somewhat obscure.
Brian Marshall
June 12, 2017


As Kscope17 rapidly approaches and I continue to look for new ways to procrastinate on the final preparations necessary for my presentations. In the meantime, I welcome you to sign up for the new EPM Marshall Weekly Newsletter! The newsletter is an automatic, once a week e-mail with the most recent posts on this blog. I’m also in the process of reconsidering my Monthly updates, which I’ve clearly failed at providing recently. So be on the lookout for a possible re-occurrence of the EPM Week in Review.
Sign Up Now
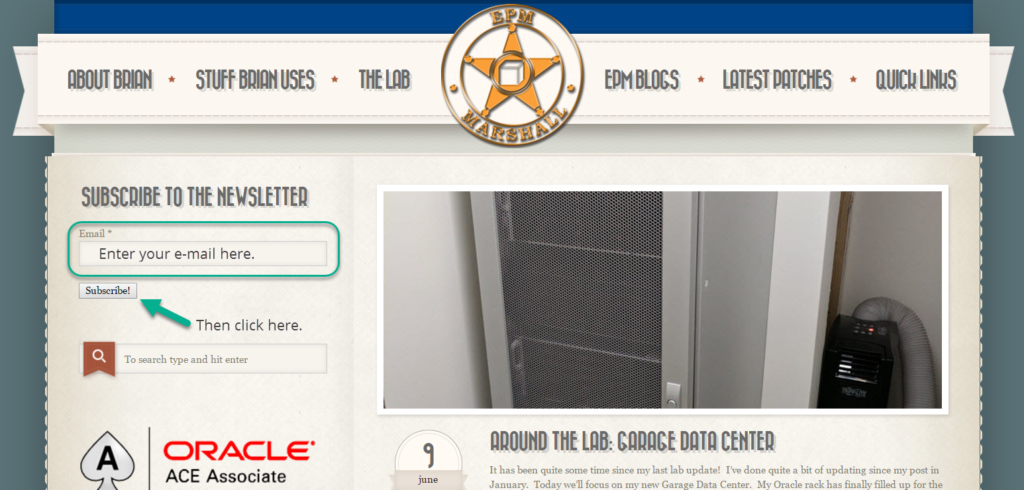
But, while you wait with baited breath for that decision, sign up for my new weekly newsletter:

Once you complete those two simple steps, you should receive and e-mail to confirm that you wish to be added to the list. This both validates your e-mail address and ensures that you really did want to join the list.
Brian Marshall
June 10, 2017
You may have noticed a massive change in the way things look around here. HyperionEPM.com is now EPMMarshall.com! And yes…this is a totally corny play on words, and I’m okay with that. I’m Brian Marshall and I like to blog about EPM. It also makes for a cool looking badge logo. As it happens, EPMMarshal.com works too if you are interested in spelling it correctly. HyperionEPM.com will also continue to work.
All of my existing content will still be here and everything will work just like it did. I decided to change the site up for a few reasons. First, if you google Hyperion EPM, you can’t get right to my website. There are too many other companies that have the top slots (I’m looking at you, Oracle). Second, Hyperion is not the only EPM technology out there. I may not blog about other technologies yet, but at least this gives me more options.
That’s all for today. I should have a lot more content coming as I finish off my presentations for Kscope17 and try to regain some of my blogging time as things hopefully slow down a little at US-Analytics. In the meantime, enjoy a giant version of my new logo:

Brian Marshall
June 5, 2017

It’s that time again…the EPM Month in Review. February was just as active as January with another 44 contributions from our great community.
Gary tells us about a new feature in Smart View 11.1.2.5.620. He also has an in-depth look at the Query Designer in Smart View.
Cameron has the results of his Smart View Survey. He also has a tip on installing just Excel 2016 instead of the entire 2016 suite of Office products. Cameron also brings us a great post on backing up your on-premises applications. Finally, he suckered Chris Rothermel into providing us with a great guide on backing up your cloud-based applications.
The DEV EPM crew tells us about the newly release Oracle Data Integrator Cloud Service (ODICS). I can’t be the only one saying that acronym out-loud right?
Neha provides public service announcement regarding a bug in Planning 11.1.2.4.005. Amit shows us a cool was to pass run-time prompts from Planning to a MaxL command rebuilding a partition.
Summer has a quick tip on the possibility that a cube refresh could fix issues in PBCS.
Eric tells us about the HFM 11.1.2.4.204 patch that was recently released. He also shows us how to view metadata properties inside of HFM (but not Smart View).
Sibin gives us a lengthy series on installing the Hyperion EPM stack in a distributed environment:
Sibin also continues his journey with the Essbase application logs. He finished off the month with another installation related post relating to a failure.
Glenn has an interesting post about FCCS and issues relating to data storage. This particular issue is not unique to just FCCS. I’ve had this exact issue occur one time before on a PBCS implementation as well.
I had a post on Parallel Data Loads in Essbase BSO cubes.
Jason asks if we’ve ever wondered what the difference is between JDBC and JNDI connections is? He has another post as well on advanced Essbase features in Dodeca.
John continues his series on the FDMEE Hybrid Update. He also has a post on loading Planning meta-data using FDMEE.
Celvin takes a break from Groovy to talk about PBCS and hierarchy driven Smartlists. He then continues his Groovy series with Part III and Part IV.
Sarah shows us how to get past an issues with the BICS Data Sync configuration.
Henri tells us about end of days for the FR Desktop Studio. Mid-2017 is coming up quick!
Ludovic gives us a run-down of the updates in February 2017 PBCS release.
Eric takes a deep dive into the new ODICS offering from Oracle.
Vijay has a pair of posts. First he covers DRM Pivots. He sticks with DRM as a topic showing how to execute the DRM Batch Client from remote servers…without anything fancy. Pretty cool…
Pete shows us how to execute shell commands in MaxL using the CalcMgrExecuteMaxLScript CDF. He also shows some of the differences between EAS and Calc Manager as it relates to validating code.
Tim gives the Dodeca support team an e-high-five.
Tony walks us through the process of enabling dynamic member creation in PBCS and Planning.
Opal gives us a recap of the RMOUG Training Days 2017 event in Denver. She also has a post about John Wick 2? Ok, so there may be something about EPM in there too…but mostly John Wick 2.
Brian Marshall
March 3, 2017
As I continue down the path of my Essbase testing and benchmarking, I’m always looking for ways to make Essbase lay waste to hardware. As I was working on my new benchmarking application, I needed to load a lot of data into a BSO cube. I’m impatient and noticed that the data load was terribly inefficient at using the available hardware on my server. Essbase was using a single CPU thread to perform the load. So how can we make this load more intensive on the server and more importantly…faster? Essbase BSO Parallel Data Loads!
I know what you’re thinking, you can’t load data to a BSO in parallel. That only works in ASO, right? Wrong! Now, admittedly the ASO functionality for parallel loads is a lot more flexible, but starting in 11.1.2.2, BSO now has a basic way to perform parallel loads. Before we get to that, let’s take a look at the SQL load that was performed. The data set is roughly 10,000,000 rows. This is the basic MaxL code used:
import database EssBench.EssBench data
   connect as hypservice identified by 'mypasswordnotyours'
   using server rules_file 'dRev'
   on error write to "e:\\data\\EssBench\\dRev.txt";
Now let’s take a look at our resource usage:

Clearly we aren’t making good use of all of those CPU’s. And here’s the timing results:

At 333 seconds, that’s not bad. But can we do better? Let’s try this as a text file and see how it compares. I exported by data to text file and changed up my MaxL to this:
import database EssBench.EssBench
   data from data_file "e:\\data\\EssBench\\dRevCogsStats.ascii"
   using server rules_file 'dtRev'
   on error write to "e:\\data\\EssBench\\dtRev.err";
And let’s look at the resource usage:

That looks familiar. We are still wasting a lot of processing power. And how long did it take?

With a time of 331 seconds, we are looking at a virtual tie with the SQL-based rule. Now let’s see what happens when we break up the file into 16 parts (more on this another day). Here’s the MaxL:
import database EssBench.EssBench using max_threads 16
   data from data_file "e:\\data\\EssBench\\dRevCogsStats*.txt"
   using server rules_file 'dtRev'
   on error write to "e:\\data\\EssBench\\dtRev.err";
We have 16 threads, let’s use them all! We have 16 files, so let’s see what happens:

That’s more like it! We still aren’t using all 16 threads fully, but at least we are using more than one! So how long did it take?

We are sitting at 219 seconds now. This is an improvement of roughly 34%. That’s a pretty nice improvement, but not nearly the improvement we would hope for given that we went from less than 10% CPU utilization to over 70% utilization. Why then did we not get a better improvement? That’s a question for another day.
In general, I found it interesting that the SQL-based load rule and the text-based load rule performed exactly the same. Obviously, the SQL-based load rule would be the faster of the two options given that we don’t have the overhead of first creating the text file. Next time, we’ll take a look at how to split a file using PowerShell.
Brian Marshall
February 22, 2017

Welcome to the second installment of the Hyperion EPM Month in Review. This month was pretty busy with 44 contributions by the community (45 if you include this post).
Gary has a quick update letting us know that the Smart View 11.1.2.5.620 has been released.
Cameron has a pair of posts this month. First he held Chris Rothermel hostage until he created a post that shows us how to delete multiple files with EPM Automate. Next up, he shows us around the new EPM Cloud Documentation Portal.
The DEV EPM crew starts off 2017 with a post covering 2016. They also tell us that they will be at Kscope17! They also have an OTN article on Building a 100% Cloud Solution with Oracle Data Integrator.
Eric gives us a look at the new Oracle Data Visualization Cloud Service. On the other end of the spectrum, he has a post about locking entities. This is a functional and technical question all rolled into one.
Sibin had another busy month of blogging. I wish I had the time or energy to blog as much as he does! He starts off the year talking about text members in Hyperion Planning. He then runs us through his experience using SQL Data Load Rules in Essbase and the error he encountered with Oracle DB. He also takes a look at the backend repository for Shared Services. Sibin also put together a cool Essbase log parsing shell. He then covers FDMEE logic accounts…twice. Finally, he has a post on installing the Hyperion EPM stack on Linux.
Glenn has an interesting post about FCCS and issues relating to data storage. This particular issue is not unique to just FCCS. I’ve had this exact issue occur one time before on a PBCS implementation as well.
I started the year off with a few posts. First I wished everyone a very belated Happy New Year. Then I started the new EPM Month in Review series with the December 2016 update. I will also be at Kscope17! I also started a new series talking about what’s up in my lab. And lastly, and most importantly, the next NTxHUG Meeting has been announced for February 16th.
Jason clearly has too much time on his hands like Sibin, giving us five blog posts this month! First, he shows off some Dodeca skills by having multiple Essbase sources in a view. Next up, he talks about renegade members in Essbase. He also has an update to his Hyperion Parent Inferrer app. Chris clearly made an impact with his post on Cameron’s blog, as Jason had to go and do his very own post on the topic from another angle: deleting multiple files from PBCS using EPM Automate PBJ. He finishes off the month with a post on Drillbridge and query translation.
John continues his awesome content to start off the year the way he ended it. He has part two of his series on FDMEE and the REST API. He also started a new series on the FDMEE Hybrid update.
Francisco gives us part two of his series on the 11.1.2.4.210 patch for FDMEE. He has a three-part series on the UDA for SAP HANA: part 1, part 2, and part 3. He also has a great extension to John Goodwin’s series on FDMEE and the REST API. He shows us how to execute custom scripts with the REST API in FDMEE.
Dayalan has a post showing the new functionality added to the PBCS Access logs. Looks like you can now download daily logs. Cool advances in the cloud. He also tells us a little about the 17.02 patch for PBCS that his this Friday (in test).
Celvin has a new multi-part series this month on Groovy in PBCS and On-Prem Planning. Here are part 1 and part 2.
Sarah takes a look at a cool new Oracle tool named Synopsis. She gives us part one her on-going series showing off this new mobile tool for analyzing CSV and Excel files on the go. She also takes a look at the new Quadrant Visualization plug-in for ODV.
Eric gives us the heads up on a variet of upcoming events and webinars.
Tim tells us that the Oracle Essbase Cloud Service (EssCS) webinar is now available. Apparently the soon part of coming soon is getting sooner…
What if the world is a prototype?
Christian has released a new version of his Tools-EPM utility for Linux and Unix! Previously this was only available for Windows.
Opal has a pair of posts this week. First she has a quick tip on Financial Reports that don’t appear after migration. She also has a big thank you to the 2016 ODTUG Marketing Committee. We all appreciate the efforts of all of the committees that make ODTUG a great community with many great events and contributions.
Brian Marshall
January 31, 2017

The next North Texas Hyperion User Group (NTxHUG) meeting has been announced and it will be on Thursday, February 16th, 2017. The event will be hosted in Irving at the Oracle office. You can find more details here:
NTxHUG Website
We’ll be getting started at 3:00 PM then heading to a happy hour at The Ranch in Las Colinas nearby. I’ll be presenting along with someone from Oracle. This quarter we’ll be discuss on-prem Hyperion tools. This includes a road-map and then integration across the stack. The Oracle Office is located at this address:
6031 Connection Drive
Irving, Texas 75039
The following happy hour will be at The Ranch at Las Colinas at this address:
857 W John Carpenter Fwy
Irving, Texas 75039
At the end of the post you will find a handy map with a pair of pins: the Oracle office in question and The Ranch at Las Colinas. I hope to see all you local to DFW there!
[iframe src=”https://www.google.com/maps/d/embed?mid=17ymdBBU4dbXD1PKC8MOzPH8K6Oo” width=”640″ height=”480″]
Brian Marshall
January 29, 2017

I’m very pleased to announce that I will be speaking at Kscope17 in San Antonio. I will be giving a presentation on Essbase performance in virtualized environments. This will contain a lot of content that you will see here, or already have seen here. I’ve very excited that this presentation was accepted as I’ve been working for over a year to get everything ready to actually present. You can find more here. The official title of my presentation is:
IT Made Me Virtualize Essbase and Performance Sucks: Making Essbase Fast In Any Environment
I’ve had the pleasure of speaking at Kscope everything year since 2010. I believe that Kscope is far and away the best Hyperion-related conference in the world. I also enjoy getting together with a large number of like-minded Hyperion Nerds. This year should be an amazing experience just like every year before.
This year we are back at the JW Marriott outside of San Antonio. For those of you that haven’t been to this particular resort, it is pretty amazing. It has a great water park, so if you want to bring the family, or have the stay the weekend after, you will really enjoy it. If you happen to be into golf, they have a LOT of golf there.
In other news, if you plan on attending or even think that you might attend, I would highly recommend booking your room early. If you happen to book to late, you might be staying down the street. And when I say down the street, I mean down the super-long entry way, down another street, and around a corner near the freeway. In other words…you don’t want to stay offsite if you don’t have to!
Luckily, we have a long time between now and June, as I have a lot of work to do to make sure that this presentation and possible white-paper are…awesome.
Brian Marshall
January 19, 2017

The Hyperion EPM Week in Review has clearly become more than I can manage on a weekly basis. So, I’ve decided to do a monthly update for the time being. If things slow down, I’ll get back to a weekly update. So, welcome to 2017 and the review of Hyperion EPM in December of 2016!
As part of this change I’ll also be structuring the posts a little different. Because over the course of a month many of us post more than once, I’ll be adding sub-heading for each of the contributing blogs along with a link to their main site. I welcome any feedback everyone has.
Garry had three posts last month. First he announced that he was selected to present at KScope17. Congrats Gary! He also lets us know about the new 11.1.2.4.704 patch for Financial Reporting. This is a particularly important update given that Oracle will no longer support the desktop client soon. While he’s updating us on patches, he also has a post about the new 11.1.2.4.210 patch for FDMEE. This includes a whole host of new features including text-based data loads.
Cameron gives us the update on the most resent Boston meetup. It looks like a lot of fun was had!
The DEV EPM crew continues their series on Dimension and Cubes in ODI 12c. The topic of the day is loading data using surrogate keys.
Keith has a post on extracting UDA’s…using Python.
Eric, much like Gary, as a post on the 11.1.2.4.704 patch for Financial Reports. This seems to be a popular topic.
Sibin had another busy month of blogging. He starts off by taking a peak at the backend tables of Shared Services. He then moves on to showing us how to create a relational data source for an Essbase rules file…on Linux. Speaking of Linux, he also has a guide on installing HFM on Oracle Linux. I’m pretty sure this is only supported on Exalytics…but hey, cool guide.
Jason has a re-cap of his most popular blog posts of 2016 to finish out the year.
John continues his awesome content to finish off the year. He has a post on loading data to multiple years and periods with FDMEE. He also has part one of his series on FDMEE and the REST API.
Francisco has a post on the 11.1.2.4.210 patch for FDMEE at a glance. He the digs deeper into the patch.
Dayalan has a post on loading data into PBCS using the HsSetValue and HsGetValue functions.
Celvin, who I had the privaledge of hanging out with over the holidays, has a number of posts in December. He has an amazing family and it was great to spend some time away from Kscope with some fellow Oracle nerds.
First he has a tip on ADFS Federation and Signing Certificate issues. Next up he has a quick tip on deleting members and shared members more rapidly in PBCS. Finally, he has a post on adding a time value to a webform.
Sarah has a post on error 10058 in Data Visualization Desktop (DVD). While on the topic of DVD, she also covers plug-ins.
Eric has a great post showing off the new and hopefully eventually released Essbase Cloud Service.
Opal has a post on opening up more than one instance of the Oracle EPM Cloud.
Brian Marshall
January 17, 2017
Welcome to 2017! This post is way late as I continue to recover from a ridiculously busy Q4 and the Holidays that go along with that. 2016 was my second year of blogging, and I’d like to think that it was a successful year. In 2017, I published 83 blog posts. I’m not sure that I’ll get anywhere near that number this year, but I’m hoping to make every post count.
This year I hope to focus more on continuing to build out my home lab to support new and interesting things. I’d also like to spend more time with cloud technologies like FCCS and ARCS that I haven’t spent as much time blogging about so far. Here’s what I hope to post on in general:
- Essbase Performance (you should see a lot on this given my presentation looms)
- PBCS
- FCCS
- More fun with PowerShell
- More posts about the Lab
- Perhaps a guest-blog or two?
I’ll finish off this post by stealing an idea from Jason and posting my top 10 blog posts from 2016:
- The Planning Repository: HSP_OBJECT and HSP_OBJECT_TYPE
- Building a Hyperion Home Lab: Introduction and Choosing Your Hypervisor
- Getting Started With Hyperion Planning 11.1.2.4 and Rapid Deployment (Part 1 of 2)
- Building a Hyperion Home Lab: Choosing Your Motherboard
- Building a Hyperion Home Lab: Choosing Your Processor
- Getting Started With Hyperion Planning 11.1.2.4 and Rapid Deployment (Part 2 of 2)
- Drill-Through in PBCS and Hyperion Planning Without FDMEE
- Enabling Dynamic Members in Custom Plan Types in 11.1.2.4
- Currency Conversion in ASO
- Veeam Backup & Replication Free Edition Experience and Sample
Brian Marshall
January 16, 2017
