Build a Homelab Dashboard: Part 6, Grafana Introduction

Another week, another part of the homelab dashboard series!  This week we will finally bring all of our work into Grafana so that we can see some pretty pictures.  Before we dive in, let’s take a look at the series so far:

  1. An Introduction
  2. Organizr
  3. Organizr Continued
  4. InfluxDB
  5. Telegraf Introduction
  6. Grafana Introduction

What is Grafana?

Grafana is the final piece of our TIG stack.  This is the part you’ve been waiting for, as it provides the actual results of our labors in the form of beautiful dashboards.  Like Telegraf and InfluxDB, Grafana is also open source, which makes it even more awesome.   Grafana really does two things, first it build (or allows you to build) a query back to a data source.  In our case, this means building an InfluxQL query.  Once the query has been prepared, Grafana then gives you the ability to make it look nice…very nice.  Let’s get started!

Installing Grafana on Linux

Installation, like everything else we’ve installed so far in this series is pretty straight forward.  We’ll start by downloading and installing Grafana using these commands:

sudo wget https://s3-us-west-2.amazonaws.com/grafana-releases/release/grafana_5.2.2_amd64.deb 
sudo dpkg -i grafana_5.2.2_amd64.deb

Executing those commands should look something like this:

Now we need to start the service:

sudo service grafana-server start

Finally we need to make sure the service starts automatically at boot each time:

sudo systemctl enable grafana-server.service

Installation complete…now let’s do some configuration.

Configuring Grafana

We’ll start by opening our browser and going to http://youripaddressorhostname:3000/:

The default username and password for the administrator account will be admin.  Once logged in, we will be prompted to change our password.  I highly recommend that you do not click the skip button:

Once you are logged in, we’ll see that we’ve only completed the first step in the five that they have listed:

  • Install Grafana
  • Add data source
  • Create your dashboard
  • Invite your team
  • Install apps & plugins

We’ll focus on the first three as its assumed that this is a homelab where you don’t have a lot of users and for now won’t need any apps or plugins.  Now we can move on to the next step.

Adding a Data Source

Now that we have Telegraf feeding stats to InfluxDB, we can start with that database as our source.  Start by clicking on Add data source:

Enter a name for the data source, choose InfluxDB for the type, enter the URL (I used localhost as I have it all on the same system), enter the name of the database, enter the username and password used to access the database.  Finally, click Save & Test:

Assuming everything went well, you should see the following:

Creating a Dashboard

Finally…after six parts of this series, we are to a point where we get to see a pretty picture.  The moment we have all been waiting for!  While I could just upload my JSON file for this dashboard, I learn much better if I actually go through and build it myself.  So we’ll go that route.  If we go back to our home dashboard, we can click on the next box:

Simple Line Graph

We’ll start with something simple, so we’ll click on Graph:

This will give you a nice looking random sample data graph:

While this is cool looking, it wasn’t exactly intuitive that you click on the panel title to get editing options:

Once you’ve clicked edit, you should have a full screen of editing options.  We’ll start by changing the data source to our newly created data source, TelegrafStats in my case:

Now we need to pick a table to pull data from.  We’ll start with something that seems simple like CPU statistics from the cpu table:

Next we’ll add host to our where clause so that we don’t try to aggregate multiples as we add in future devices:

And now we need to specify the host we wish to filter on:

Finally, we can select a field.  In some cases, this will a single value of interest.  As we look at CPU options, we’ll notice that there are quite a few to select from.  This will vary based on the operating system that we are using, but in my case (Debian Stretch), I have a lot of choices.  We’ll start by picking a single item from the list:

Before we get into the rest of our CPU options, let’s give our series a name:

Given that we have all of these choices, we really need all of them on the graph to adequately illustrate CPU utilization.  To make this a faster process, we’ll simply duplicate our first entry.  We’ll click the menu button on the query and select Duplicate:

We’ll do this for every field available so that we can represent all of the possible ways our CPU will be utilized.  Now that we’ve added all of our data, its time to make things look a little more polished.  We’ll start with our legend.  Click on the Legend tab:

I prefer to see more information on my legend.  Grafana gives us a great selection of options.  I’ve chosen to display my legend as a table with min, max, avg, and current values:

Next we’ll click on our General tab so that we can adjust our title:

The only thing left to do now is to adjust a few settings about our axes.  From the Axes tab, we’ll select the unit of none followed by the unit of percent (0-100):

Now that we have it set to percent, we’ll also want to set the range from 0 to 100 as our usage should never exceed 100:

Next we need to click back and actually save our work.  Up until this point, nothing we have done has been saved.  Once we have clicked the back button in the top right corner, we should see our completed panel and we’re ready to click the save button:

Now we just need to enter a name for the new dashboard and click Save:

We have officially created our first dashboard in Grafana!  But wait, that will be a pretty boring dashboard.  Let’s add some memory and disk metrics next.  To do this, we’ll use a different type of visualization.

Singlestat (Gauge)

Everyone loves pretty gauges, so let’s add one or two of those to our dashboard.  To create a gauge we add a new panel:

The Singlestat panel can be modified the same way as our graph:

Now we modify our query just like we did with a graph and then we’ll go to the options tab:

We’re going to first change our stat.  Essentially we want to change it from the default of Average to the setting of Current.  This ensures that our gauge will always show the most recent value rather than an average of the time period selected.  We also need to change our thresholds, I chose 70 and 90 for my orange and red.  We’ll also set our gauge to Show and set our units to percent.  If your colors are reversed, just click the Invert button:

Once we have our gauge configured, we just need to name our panel:

One More SingleStat

I won’t go step by step, but here are the settings I used for the disk space gauge:

The Dashboard

Finally, we have a dashboard.  I moved things around a bit and ended up with this:

Putting It All Together

Now that we have a dashboard, we should be ready to put it all together.  This means all the way back to Organizr.  Before we head over there, we need to copy a link.  Click on the share button:

Next we will deselect Current time range and Template variables.  Finally we’ll copy the link:

We’ll head back over the Organizr and go to our Tab Editor and click the add new tab button:

Now we just need to name our tab, paste our URL, and choose the Grafana logo:

And once we reload Organizr, here we go:

Conclusion

If you have followed the entire series so far, you should have a fully functionally dashboard inside of Organizr.  Soup to nuts as promised.  We’ll continue the series by adding in more and more devices and data into InfluxDB and Grafana…another day.


Build a Homelab Dashboard: Part 5, Telegraf Introduction

As we continue on our homelab dashboard journey, we’re ready to start populating our time-series database (InfluxDB) with some actual data.  To do this, we’ll start by installing Telegraf.  But, before we dive in, let’s take a at the series so far:

  1. An Introduction
  2. Organizr
  3. Organizr Continued
  4. InfluxDB
  5. Telegraf Introduction

What is Telegraf

In part 1 of this series, I gave a brief overview of Telegraf, but as we did with InfluxDB in our last post, let’s dig a little deeper.  Telegraf is a server agent designed to collect and report metrics.  We’ll look at Telegraf from two perspectives.  The first perspective is using Telegraf to gather statistics about the server on which it has been installed.  This means that Telegraf will provide us data like CPU usage, memory usage, disk usage, and the like.  It will take that data and send it over to our InfluxDB database for storage and reporting.

The second perspective is using Telegraf to connect to other external systems and services.  For instance, we can use Telegraf to connect to a Supermicro system using IPMI or to a UPS using SNMP.  Each of these sets of connectivity represents an input plugins  The list of plugins is extensive and far too long to list.  We’ll cover several of the plugins in future posts, but today we’ll focus the basics.  Before we get into the installation, let’s take see what this setup looks like in the form of a diagram:

Looking at the diagram, we’ll see that we have our monitoring server with InfluxDB, Telegraf, and Grafana.  Next we have a couple of examples of systems running the Telegraf agent on both Windows and FreeBSD.  Finally, we have the other “things” box.  This includes our other devices that Telegraf monitors without needing to actually be installed.  The coolest part about Telegraf for my purposes is that it seems to work with almost everything in my lab.  The biggest miss here is vmWare, which does not have a plugin yet.  I’m hoping this changes in the future, but for now, we’ll find another way to handle vmWare.

Installing Telegraf on Linux

We’ll start by installing Telegraf onto our monitoring server that we started configuring way back in part 2 of this series.  First we’ll log into our Linux box using PuTTY:

Next, we’ll download the software using the following commands:

sudo wget https://dl.influxdata.com/telegraf/releases/telegraf_1.7.1-1_amd64.deb
sudo dpkg -i telegraf_1.7.1-1_amd64.deb

The download and installation should look something like this:

Much like our InfluxDB installation…incredibly easy.  It’s actually even easier than InfluxDB in that the service should already be enabled and running.  Let’s make sure:

sudo systemctl status telegraf

Assuming everything went well we should see “active (running)” in green:

Now that we have completed the installation, we can move on to configuration.

Configuring Telegraf

For the purposes of this part of the series, we’ll just get the basics set up.  In future posts we’ll take a look at all of the more interesting things we can do.  We’ll start our configuration by opening the config file in nano:

sudo nano /etc/telegraf/telegraf.conf

We mentioned input plugins earlier as it related to getting data, but now we’ll look at output plugins to send data to InfluxDB.  We’ll uncomment and change the lines for urls, database, timeout, username, and password:


Save the file with Control-O and exit with Control X.  Now we can restart the service so that our changes will take effect:

sudo systemctl restart telegraf

Now let’s log in to InfluxDB make sure we are getting data from Telegraf.  We’ll use this command:

influx -username 'influxuser' -password 'influxuserpassword' -database 'TelegrafStats'

Once logged in, we can execute a command to see if we have any measurements:

SHOW MEASUREMENTS

This should all look something like this:


By default, the config file has settings ready to go for the following:

  • CPU
  • Disk
  • Disk IO
  • Kernel
  • Memory
  • Processes
  • Swap
  • System

These will be metrics only for the system on which we just installed Telegraf.  We can also take a look at the data just to get a look before we make it over to Grafana:

SELECT * FROM cpu LIMIT 5

This should show us 5 records from our cpu table:

Conclusion

With that, we have completed our configuration and will be ready to move on to visualizations using Grafana…in our next post.


PowerShell from Workspace: Better Than a Batch

There are no less than three blog posts about running a batch script from Workspace floating around the internet.  I believe the first originated from Celvin here.  While this method works great for executing a batch, you are still stuck with a batch.  Not only that, but if you update that batch, you have to go through the process of replacing your existing batch.  This sounds easy, but if you want to keep your execution history, it isn’t.  Today we’ll use a slightly modified version of what Celvin put together all those years ago.  Instead of stopping with a batch file, we’ll execute PowerShell from Workspace.

Introduction to PowerShell

In short, PowerShell is a powerful shell built into most modern versions of Windows (both desktop and server) meant to provide functionality far beyond your standard batch script.  Imagine a world where you can combine all of the VBScript that you’ve linked together with your batch scripts.  PowerShell is that world.  PowerShell is packed full of scripting capabilities that make things like sending e-mails no longer require anything external (except a mail server of course).  Basically, you have the power of .NET in batch form.

First an Upgrade

We’ll start out with a basic batch, but if you look around at all of the posts available, none of them seem to be for 11.1.2.4.  So, let’s take his steps and at least give them an upgrade to 11.1.2.4.  Next, we’ll extend the functionality beyond basic batch files and into PowerShell.  First…the upgrade.

Generic Job Applications

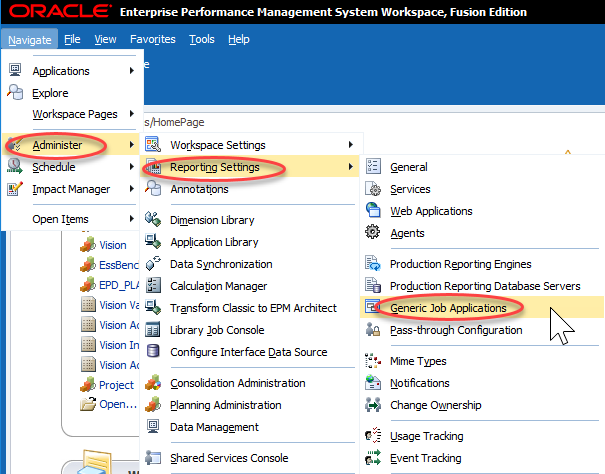
I’ll try to provide a little context along with my step-by-step instructions.  You are probably thinking…what is a Generic Job Application?  Well, that’s the first thing we create.  Essentially we are telling Workspace how to execute a batch file.  To execute a batch file, we’ll use cmd.exe…just like we would in Windows.  Start by clicking Administer, then Reporting Settings, and finally Generic Job Applications:

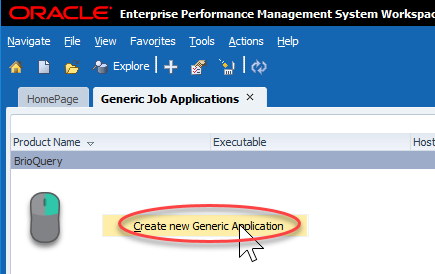
This will bring up a relatively empty screen.  Mine just has BrioQuery (for those of you that remember what that means…I got a laugh).  To create a new Generic Job Application, we have to right-click pretty much anywhere and click Create new Generic Application:

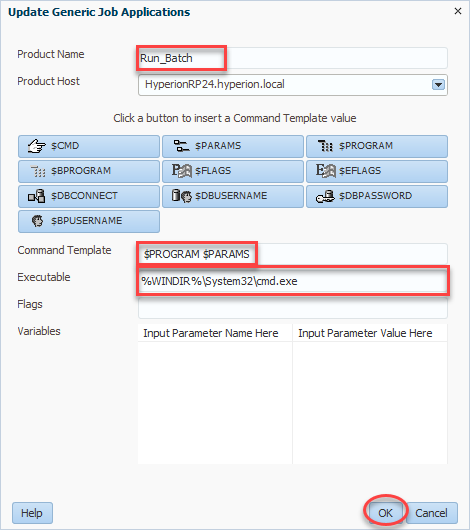
For product name, we’ll enter Run_Batch (or a name of your choosing).  Next we select a product host which will be your R&A server.  Command template tells Workspace how to call the program in question.  In our case we want to call the program ($PROGRAM) followed by any parameters we wish to define ($PARAMS).  All combined, our command template should read $PROGRAM $PARAMS.  Finally we have our Executable.  This will be what Workspace uses to execute our future job.  In our case, as preiovusly mentioned, this will be the full path to cmd.exe (%WINDIR%\System32\cmd.exe).  We’ll click OK and then we can move on to our actual batch file:

The Batch

Now that we have something to execute our job, we need…our job.  In this case we’ll use a very simple batch script with just one line.  We’ll start by creating this batch script.  The code I used is very simple…call PowerShell script:

%WINDIR%\system32\WindowsPowerShell\v1.0\powershell.exe e:\data\PowerShellTest.ps1

So, why don’t I just use my batch file and perform all of my tasks?  Simple…PowerShell is unquestionably superior to a batch file.  And if that simple reason isn’t enough, this method also let’s us separate the job we are about to create from the actual code we have to maintain in PowerShell.  So rather than making changes and having to figure out how to swap out the updated batch, we have this simple batch that calls something else on the file system of the reporting server.  I’ve saved my code as BatchTest.bat and now I’m ready to create my job.

The Job

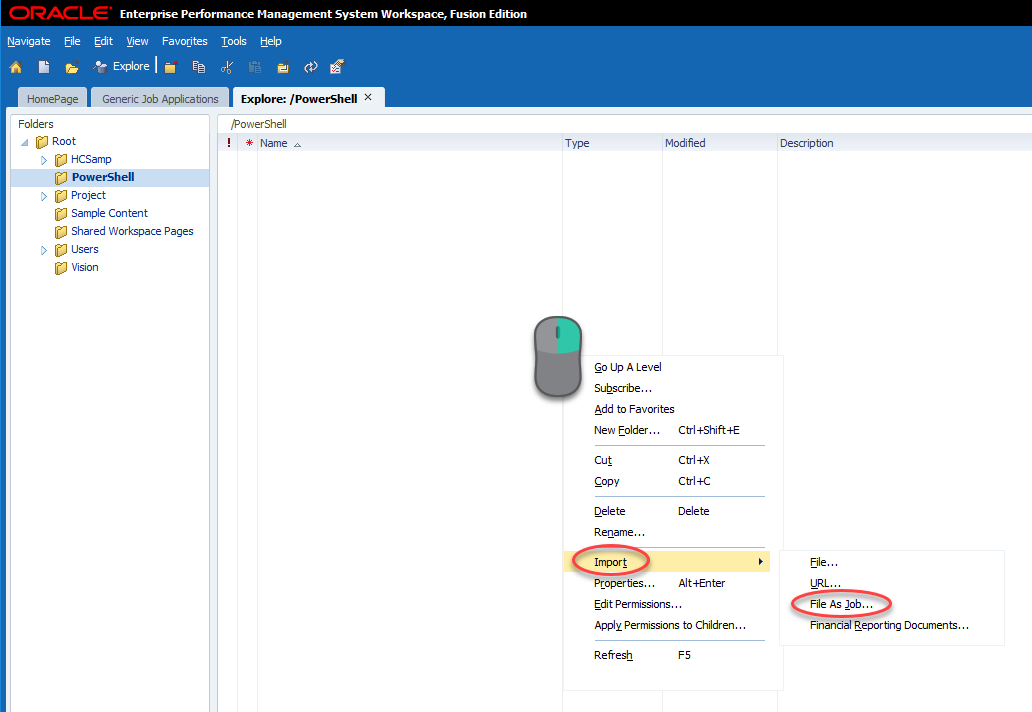
We’ll now import our batch file as a job.  To do this we’ll go to Explore, find a folder (or create a folder) that we will secure for only people that should be allowed to execute our batch process.  Open that folder, right-click, and click Import and then File As Job…:

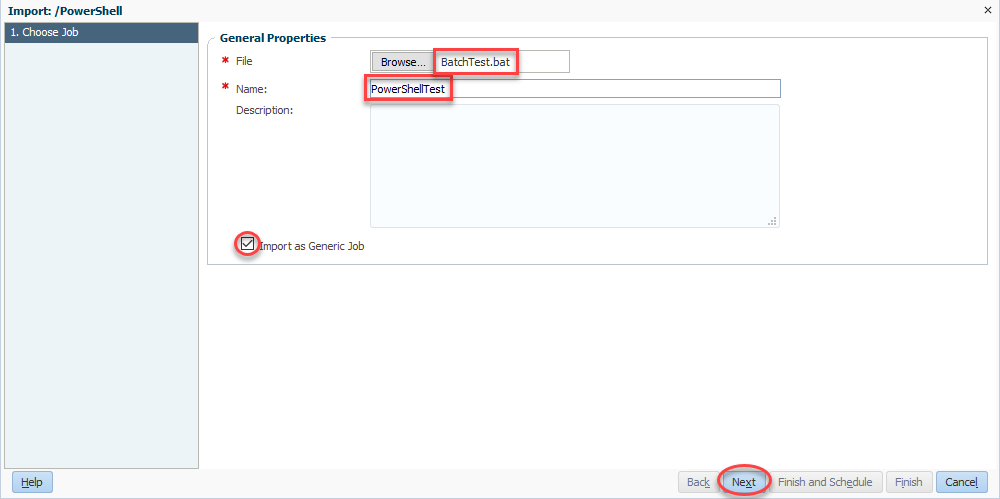
We’ll now select our file (BatchTest.bat) and then give our rule a name (PowerShellTest).  Be sure to check Import as Generic Job and click Next:

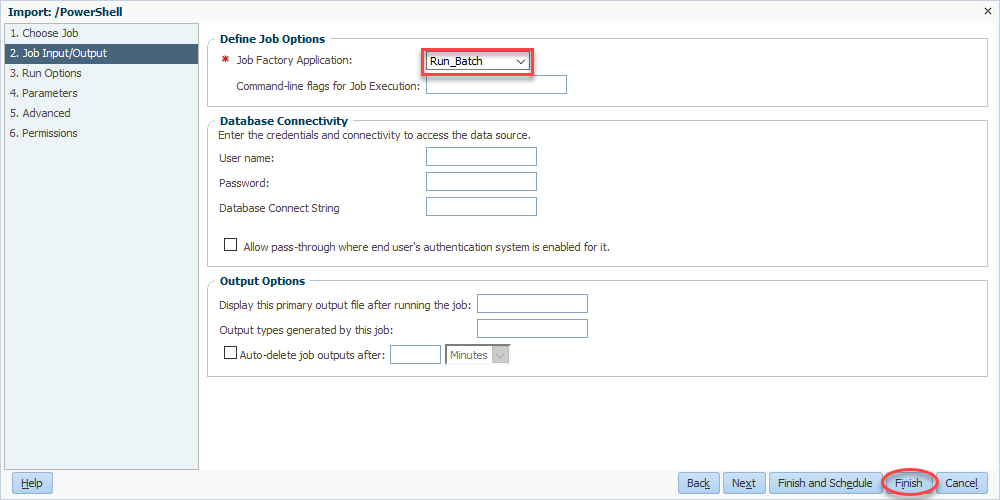
Now we come full circle as we select Run_Batch for our Job Factory Application.  Finally, we’ll click finish and we’re basically done:

Simple PowerShell from Workspace

Wait!  We’re not actually done!  But we are done in Workspace, with the exception of actually testing it out.  But before we test it out, we have to go create our PowerShell file.  I’m going to start with a very simple script that simple writes the username currently executing PowerShell to the screen.  This let’s us do a few things.  First, it let’s you validate the account used to run PowerShell.  This is always handy to know for permissions issues.  Second, it let’s you make sure that we still get the output of our PowerShell script inside of Workspace.  Here’s the code:

$User = [System.Security.Principal.WindowsIdentity]::GetCurrent().Name
Write-Output $User

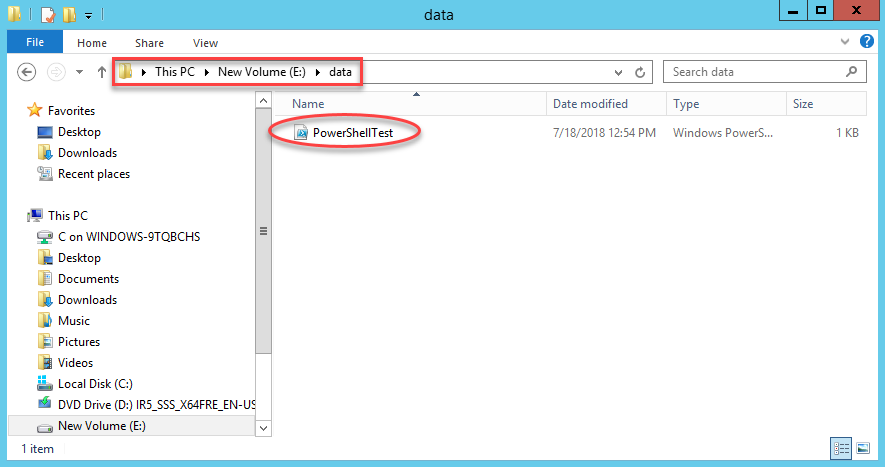
Now we need to make sure we put this file in the right place.  If we go back up to the very first step in this entire process, we select our server.  This is the server that we need to place this file on.  The reference in our batch file above will be to a path on that system.  In my case, I need to place the file into e:\data on my HyperionRP24 server:


Give it a Shot

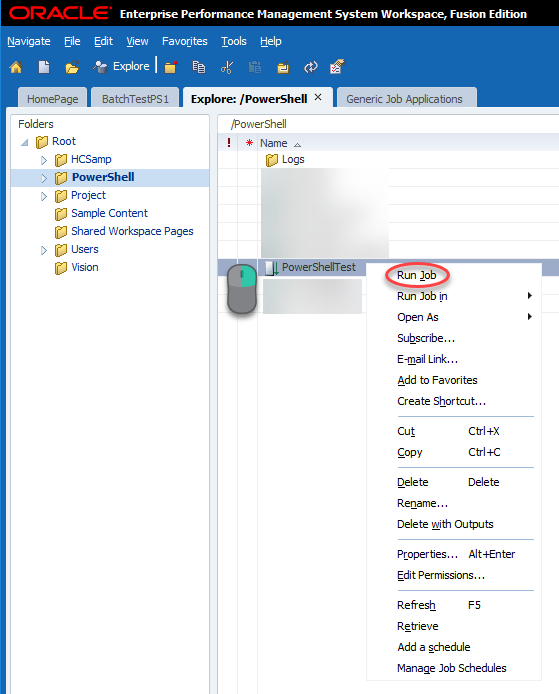
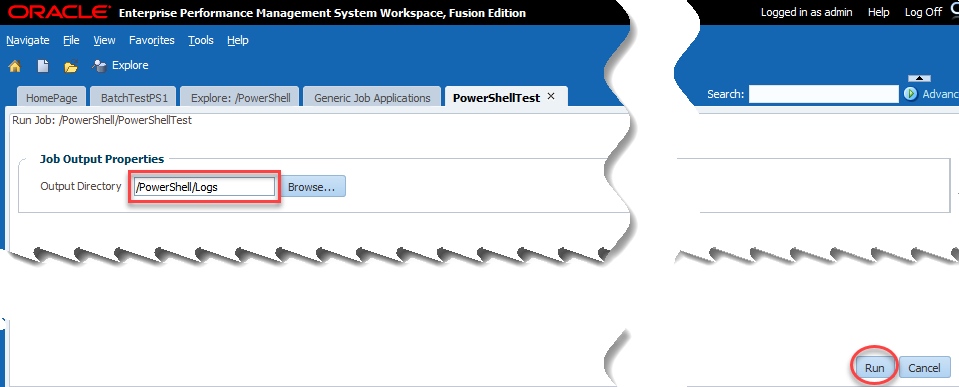
With that, we should be able to test our batch which will execute PowerShell from Workspace.  We’ll go to Explore and find our uploaded job, right-click, and click Run Job:

Now we have the single option of output directory.  This is where the user selects where to place the log file of our activities essentially.  I choose the logs directory that I created:

If all goes according to plan, we should see a username:

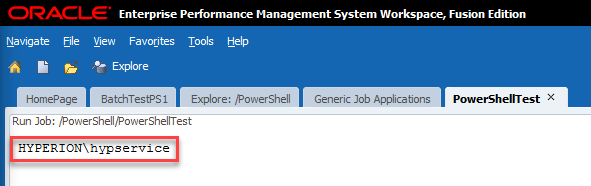
As we can see, my PowerShell script was executed by Hyperion\hypservice which makes sense as that’s my Hyperion service used to run all of the Hyperion services.

Now the Fun

We have successfully recreated Celvin’s process in 11.1.2.4.  Now we are ready to extend his process further with PowerShell.  We already have our job referencing our PowerShell script stored on the server, so anything we choose to do from here on out can be independent of Hyperion.  And again, running PowerShell from Workspace gives us so much more functionality, we may as well try some of it out.

One Server or Many?

In most Hyperion environments, you have more than one server.  If you have Essbase, you probably still have a foundation server.  If you have Planning, you might have Planning, Essbase, and Foundation on three separate machines.  The list of servers goes on and on in some environments.  In my homelab, I have separate virtual machines for all of the major components.  I did this to try to reflect what I see at most clients.  The downside is that I don’t have everything installed on every server.  For instance, I don’t have MaxL on my Reporting Server.  I also don’t have the Outline Load Utility on my Reporting Server.  So rather than trying to install all of those things on my Reporting Server, some of which isn’t even supporting, why not take advantage of PowerShell.  PowerShell has the built-in capability to execute commands on remote servers.

Security First

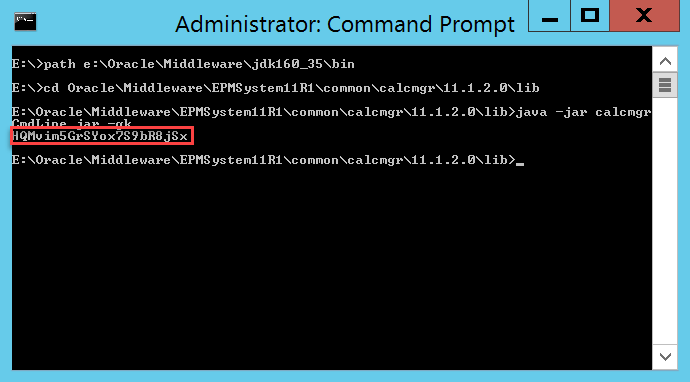
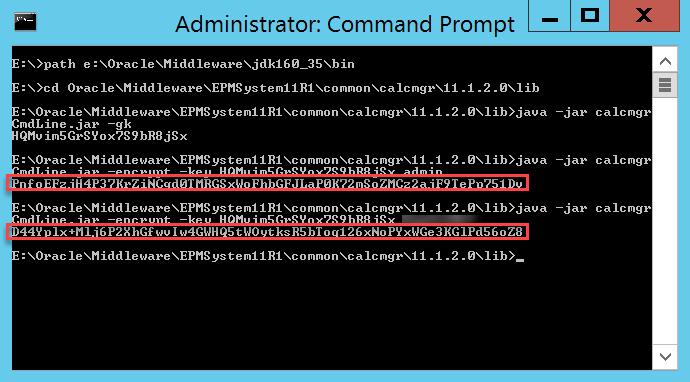
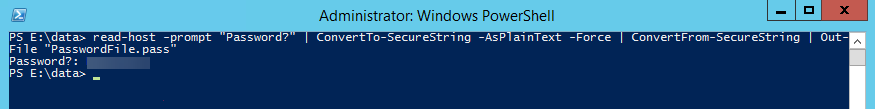
Let’s get started by putting our security hat on.  We need to execute a command remotely.  To do so, we need to provide login credentials for that server.  We generally don’t want to do this in plain text as somebody in IT will throw a flag on the play.  So let’s fire up PowerShell on our reporting server and encrypt our password into a file using this command:

read-host -prompt "Password?" | ConvertTo-SecureString -AsPlainText -Force | ConvertFrom-SecureString | Out-File "PasswordFile.pass"

This command requires that you type in your password which is then converted to a SecureString and written to a file.  It’s important to note that this encrypted password will only work on the server that you use to perform the encryption.  Here’s what this should look like:

If we look at the results, we should have an encrypted password:

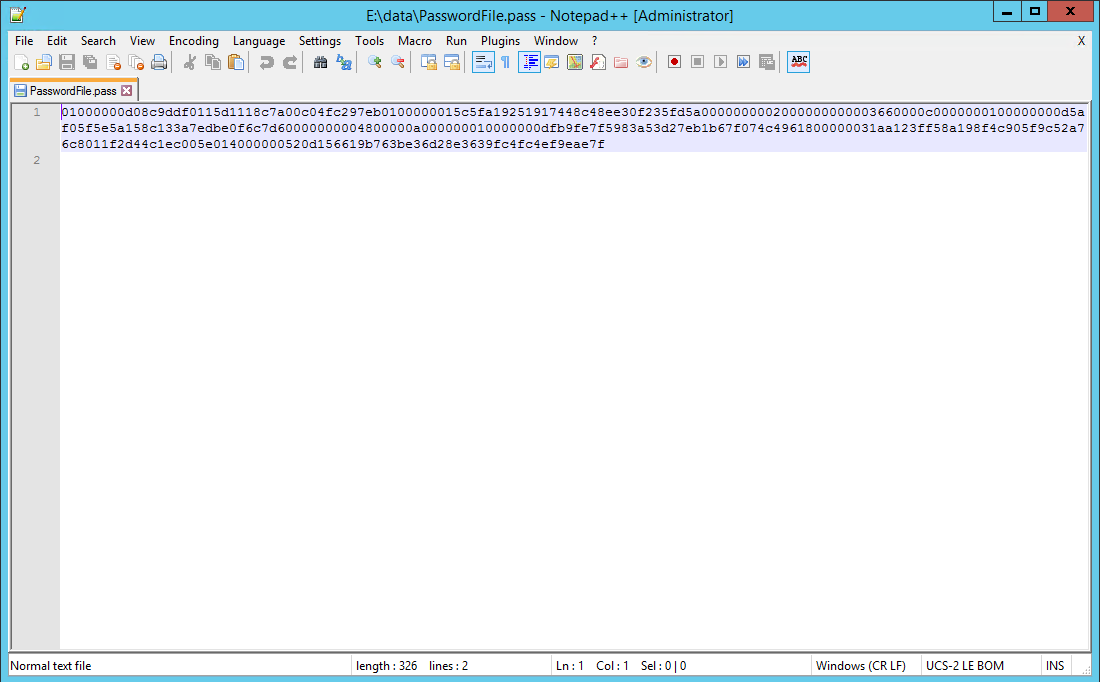
Now let’s build our PowerShell script and see how we use this password.

Executing Remotely

I’ll start with my code which executes another PowerShell command on our remote Essbase Windows Server:

###############################################################################
#Created By:	Brian Marshall
#Created Date:	7/19/2018
#Purpose:		Sample PowerShell Script for EPMMarshall.com
###############################################################################

###############################################################################
#Variable Assignment
###############################################################################
#Define the username that we will log into the remote server
$PowerShellUsername = "Hyperion\hypservice"
#Define the password file that we just created
$PowerShellPasswordFile = "E:\Data\PasswordFile.pass"
#Define the server name of the Essbase server that we will be logging into remotely
$EssbaseComputerName = "HyperionES24V"
#Define the command we will be remotely executing (we'll create this shortly)
$EssbaseCommand = {E:\Data\RemoteSample\RemoteSample.ps1}

###############################################################################
#Create Credential for Remote Session
###############################################################################
$PowerShellCredential=New-Object -TypeName System.Management.Automation.PSCredential -ArgumentList $PowerShellUsername, (Get-Content $PowerShellPasswordFile | ConvertTo-SecureString)

###############################################################################
#Create Remote Session Using Credential
###############################################################################
$EssbaseSession = New-PSSession -ComputerName $EssbaseComputerName -credential $PowerShellCredential


###############################################################################
#Invoke the Remote Job
###############################################################################
$EssbaseJob = Invoke-Command -Session $EssbaseSession -Scriptblock $EssbaseCommand 4>&1
echo $EssbaseJob

###############################################################################
#Close the Remote Session
###############################################################################
Remove-PSSession -Session $EssbaseSession

Basically we assign all of our variables, including the use of our encrypted password.  Then we create a credential using those variables.  We then use that credential to create a remote session on our target Essbase Windows Server.  Next we can execute our remote command and write out the results to the screen.  Finally we close out our remote connection.  But wait…what about our remote command?

Get Our Remote Server Ready

Before we can actually remotely execute on a server, we need to start up PowerShell on that remove server and enable remote connectivity in PowerShell.  So…log into your remote server and start PowerShell, and execute this command:

Enable-PSRemoting -Force

If all goes well, it should look like this:

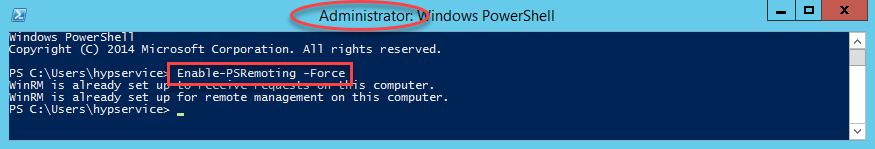
If all doesn’t go well, make sure that you started PowerShell as an Administrator.  Now we need to create our MaxL script and our PowerShell script that will be remotely executed.

The MaxL

First we need to build a simple MaxL script to test things out.  I will simply log in and out of my Essbase server:

login $1 identified by $2 on $3;

logout;

The PowerShell

Now we need a PowerShell script to execute the MaxL script:

###############################################################################
#Created By:	Brian Marshall
#Created Date:	7/19/2018
#Purpose:		Sample PowerShell Script for EPMMarshall.com
###############################################################################

###############################################################################
#Variable Assignment
###############################################################################

$MaxLPath = "E:\Oracle\Middleware\user_projects\Essbase1\EssbaseServer\essbaseserver1\bin"
$MaxLUsername = "admin"
$MaxLPassword = "myadminpassword"
$MaxLServer = "hyperiones24v"

###############################################################################
#MaxL Execution
###############################################################################
& $MaxLPath\StartMaxL.bat E:\Data\RemoteSample\RemoteSample.msh $MaxLUsername $MaxLPassword $MaxLServer

This is as basic as we can make our script.  We define our variables around usernames and servers and then we execute our MaxL file that logs in and out.

Test It First

Now that we have that built, let’s test it from the Essbase Windows Server first.  Just fire up PowerShell and go to the directory where you file exists and execute it:

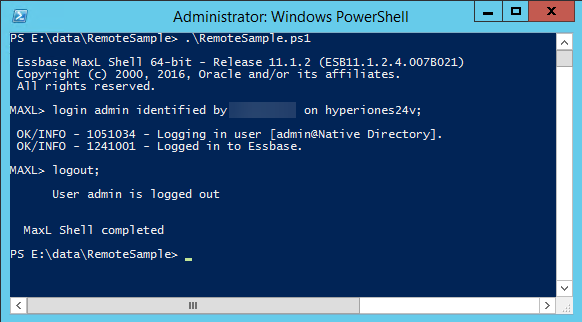
Assuming that works, now let’s test the remote execution from our reporting server:

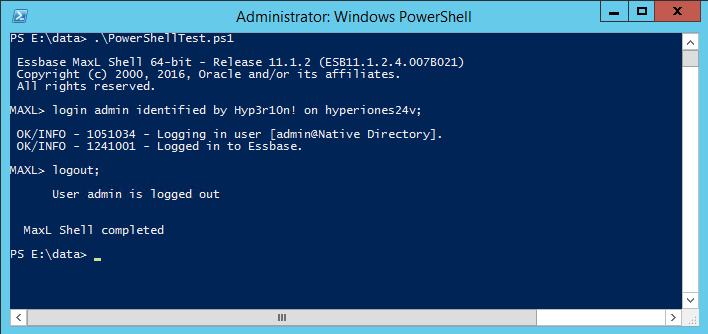
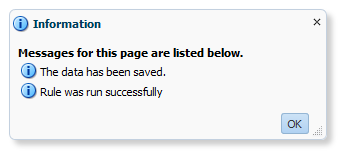
Looking good so far..  Now let’s head back to Workspace to see if we are done:
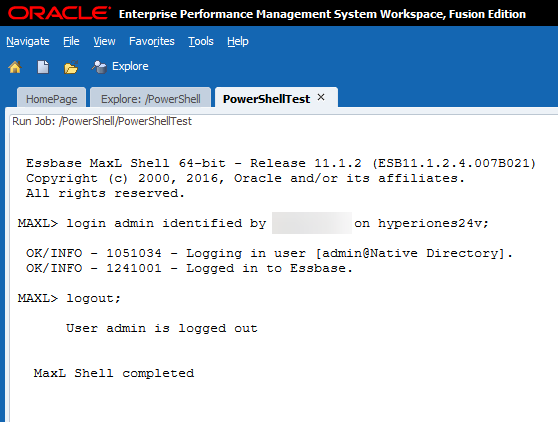
Conclusion

That’s it!  We have officially executed a PowerShell script which remotely executes a PowerShell script which executes a MaxL script…from Workspace.  And the best part is that we get to see all of the results from Workspace and the logs are stored there until we delete them.  We can further extend this to do things like load dimensions using the Outline Load Utility or using PowerShell to send e-mail confirmations.  The sky is the limit with PowerShell!


Build a Homelab Dashboard: Part 4, InfluxDB

Now that we have our foundation laid with a fresh installation of Debian and Organizr, we can now move on to the data collection portion of our dashboard.  After all, we have to get the stats about our homelab before we can make them into pretty pictures.  Before we can go get the stats, we need a place to put them.  For this, we’ll be using the open source application InfluxDB.  Before we dive in, let’s take a at the series so far:

What is InfluxDB?

In part 1 of this series, I gave a brief overview of InfluxDB, but let’s dig a little deeper.  At the very basic level, InfluxDB is a time-series database for storing events and statistics.  The coolest part about InfluxDB is the HTTP interface that allows virtually anything to write to it.  Over the next several posts we’ll see Telegraf, PowerShell, and Curl as potential clients to write back to InfluxDB.  You can download InfluxDB directly from GitHub where it is updated very frequently.  It supports authentication with multiple users and levels of security and of course multiple databases.

Installing InfluxDB

Installing InfluxDB is a pretty easy operation.  We’ll start by logging into our Linux box using PuTTY:


We’ll issue this command (be sure to check here for the latest download link):

sudo wget https://dl.influxdata.com/influxdb/releases/influxdb_1.5.4_amd64.deb
sudo dpkg -i influxdb_1.5.4_amd64.deb

The download and installation should look something like this:

Almost too easy, right?  I think that’s the point!  InfluxDB is meant to be completely dependency free.  Let’s make sure everything really worked by enabling the service, starting the service, and checking the status of the service:

sudo systemctl enable influxdb
sudo systemctl start influxdb
systemctl status influxdb

If all went well, we should see that the service is active and running:


Configuring InfluxDB

We’ll stay in PuTTY to complete much of our configuration.  Start influx:

influx

This should start up our command line interface for InfluxDB:

Authentication

By default, InfluxDB does not require authentication.  So let’s fix that by first creating an admin account so that we can enable authentication:

CREATE USER "influxadmin" WITH PASSWORD 'influxadminpassword' WITH ALL PRIVILEGES
exit

You’ll notice that it isn’t terribly verbose:

Once we have our user created, we should be ready to enable authentication.  Let’s fire up nano and modify the configuration file:

 sudo nano /etc/influxdb/influxdb.conf

Scroll through the file until you find the [http] section and set auth-enabled to true:

Write out the file with control-o and exit with control-x and you should be ready to restart the service:

sudo systemctl restart influxdb

Now we can log back in using our newly created username and password to make sure that things work:

Create Databases

The final steps are to create a few databases finally a user to access them.  You can just use the admin use you created, but generally its better to have a non-admin account:

CREATE DATABASE "TelegrafStats"
CREATE DATABASE "vmWareStats"
CREATE DATABASE "PowerShellStats"

I created three databases for my setup.  One for use with Telegraf, one to store various vmWare specific metrics, and one for all of the random stuff I like to do with PowerShell.  All of these will get their own set of blog posts in time.

Grant Permissions

Finally, we can create our user or users and grant access to the newly created databases:

CREATE USER "influxuser" WITH PASSWORD 'influxuserpassword'
GRANT ALL ON "TelegrafStats" TO "influxuser"
GRANT ALL ON "vmWareStats" TO "influxuser"
GRANT ALL ON "PowerShellStats" TO "influxuser"

Again…not terribly verbose:


Retention

By default, when you create a database in InfluxDB, it sets the retention to infinite.  For me, being a digital packrat, this is exactly what I want.  So I’m going to leave my configuration alone.  But…for everyone else, you can find a guide on retention and downsampling here in the official InfluxDB documention.  You can find the specific command details here.

Conclusion

That’s it!  InfluxDB is now ready to receive information.  In our next post, we’ll move on to Telegraf so that we can start sending it some data!

Version Update

When this blog post was written, InfluxDB 1.5.4 was the latest release.  Before I was able to publish this blog post, InfluxDB 1.6 was released.  Feel free to install that version instead of the version above:

sudo wget https://dl.influxdata.com/influxdb/releases/influxdb_1.6.0_amd64.deb
sudo dpkg -i influxdb_1.6.0_amd64.deb

Homelab Software Licensing

I frequent /r/homelab and recently I’ve read a number of posts regarding how to get licensing for your homelab.  Obviously, there are plenty of unscrupulous ways to get access to software, but I prefer to keep everything on my home network legit.  So, how do you do that?  Software licensing is somewhat difficult for regular software and it isn’t any easier for a homelab.  We’ll talk through how to get low-cost, totally legitimate licensing for vmWare, Microsoft, and a few backup solutions for your homelab.  We will not talk about all of the software that you might use in your homelab in general.  For instance, we will not cover storage server software like FreeNAS.  If you would like to see a great list of things people use in their homelabs, I would suggest checking out the software page of the /r/homelab wiki here.

vmWare Software Licensing

vmWare still offers a free Hypervisor in the form of vmWare vSphere Hypervisor.  The downside is that you don’t get a fully featured vmWare experience.  Namely, you don’t get access to the API’s.  This means much of the backup functionality won’t be available and general management is more difficult without vCenter.  The cheapest way to get a production copy of vmWare is through the Essentials packages.  The regular package is only $495 and includes a basic version of vCenter along with three server licenses for ESXi (2 sockets per server).  It’s not a terrible deal at all, but vCenter is very limited.  And for a homelab, who needs production licensing anyway?

So we have an option, but it isn’t cheap and doesn’t give us the full stack.  Enter VMUG Advantage.  For only $200 per year (yes, you have to pay it every year), you get basically everything.  VMUG Advantage gives you all of this:

  • EVALExperience
  • 20% Discount on VMware Training Classes
  • 20% Discount on VMware Certification Exams
  • 35% Discount on VMware Certification Exam Prep Workshops (VCP-NV)
  • 35% Discount on VMware Lab Connect
  • $100 Discount on VMworld Attendance

All of those things are great, but the very first one is the one that matters.  EVALExperience gives us all of the following:

  • VMware vCenter Server v6.x Standard
  • VMware vSphere® ESXi Enterprise Plus with Operations Management™ (6 CPU licenses)
  • VMware NSX Enterprise Edition (6 CPU licenses)
  • VMware vRealize Network Insight
  • VMware vSAN™
  • VMware vRealize Log Insight™
  • VMware vRealize Operations™
  • VMware vRealize Automation 7.3 Enterprise
  • VMware vRealize Orchestrator
  • VMware vCloud Suite® Standard
  • VMware Horizon® Advanced Edition
  • VMware vRealize Operations for Horizon®
  • VMware Fusion Pro 10
  • VMware Workstation Pro 14

That’s more like it.  Granted, we have the on-going annual expense of $200, but you can really go learn every aspect of vmWare with EVALExperience.

Microsoft Software Licensing

Microsoft licensing is about as complex as you can find.  Like vmWare, Microsoft offers a free version of their Hypervisor (Hyper-V), but Microsoft has a much broader set of software to offer in general.  Once upon a time, we had an inexpensive Technet subscription which gave us the world in evaluation software.  This is but a memory at this point so we have to find other options.  There are two great options on this front that are perhaps not as inexpensive, but will still give most of us what we need.

Microsoft Action Pack

We’ll start, as we did with vmWare licensing, with production-use licensing.  The Microsoft Action Pack is essentially a very low level version of being a Microsoft Partner.  It gives you access to a host of software for production use, but doesn’t really have a dev/test option.  For a homelab, this is still pretty good, because we get the latest Microsoft software at a fraction of the cost of individual licensing.  There are gotchas of course.  You do have to renew every year, and the initial fee is $475.  If you are lucky, you can find coupons to get that number way down.  So what do you get?  Here’s a sub-set:

  • Office 365 for 5 users
  • Windows Server 2016 for 16 cores
    • This is basically one server, which Microsoft requires that you purchase 16 cores minimum per physical server
    • Even if you physical server is running ESXi, you must have a Windows License if you are going to run a Windows VM
    • This license only allows you to run 2 Windows VM per physical host
    • You must purchase 16 core licenses per 2 VM’s you need per physical host
  • SQL Server 2017 for 2 servers (10 CALs)
  • Office 2016 Professional Plus for 10 computers
  • Visual Studio Professional for 3 users
  • Plenty of other great software like SharePoint, Exchange, etc.

But wait…there’s a downside.  First, those are all current versions of the software.  Many of us are forced to work with older version of Windows and SQL Server for our internal testing an development.  So this doesn’t work great.  Second, these are again, production licenses.  So we are paying a very low price, but this is software intended for a business to operate.  It’s a great deal, but not the best fit for every homelab.  You can find a full list of software included here.  I’ve had this subscription for years, but let’s move on to another option.

Visual Studio Subscriptions

So Technet is dead and the Action Pack isn’t for everyone…never fear, there is another option:  Visual Studio Subscriptions.  This is really designed for a developer and is the new branding of what was once an MSDN Subscription.  The good new is that many of us with a homelab use software more like a developer anyway.  So with the right subscription, we get access to basically everything, unlimited, for development and testing purposes.  Of course, everything is expensive, so we have to find the right software selection at a price that we can afford.  There are two main flavors of Visual Studio Subscriptions:  Cloud and Standard.

Cloud

Cloud is sold as a monthly or annual subscription.  You only get to use the license keys while you are paying the subscription.  The annual option includes subscriber benefits while the monthly service basically just includes Visual Studio-related software.  So what are subscriber benefits?  The biggest benefit for a homelab is “software for dev/test.”  What you get depends entirely on how much you shell out for your annual subscription.

  • Visual Studio Enterprise
    • Basically everything…but it cost $2,999 per year
  • Visual Studio Professional
    • Limited to Operating Systems and SQL Server for the most part…but costs only $539 per year

Obviously, Enterprise sounds great, but is likely cost prohibitive unless you have a lot of disposable income.  It can be tax deductible for those of you that have your own business.  For me, the Professional subscription gives me the two most important things, my operating systems and databases.  Not only that, it gives you basically every version of both back to the year 2000.  What it doesn’t give you is Office.  This is a bit of a bummer if you are looking for a catch-all for your homelab and productivity software.

Standard

Standard is different than the cloud subscription in that it comes with a perpetual license.  So, if you decide after the first year you are no longer interested, anything you licensed during your first year will still be yours to use.  It of course come with a higher price.  Here’s the breakout:

  • Visual Studio Enterprise
    • Basically everything, but for the OMG price of $5,999 for the first year and $2,569 to renew each year after that
  • Visual Studio Professional
    • Again limited to Operating Systems and SQL Server for the most part, but way more reasonably priced at $1,199 for the first year and $799 to renew each year after that
  • Visual Studio Test Professional
    • I can’t for the life of me figure out why anyone would want this version…but it’s $2,169 for the first year and $899 to renew each year after that

So…this is expensive.  The only real benefit here is that you can continue to use your keys if you choose not to renew each year.  Of course, if you like to be bleeding edge, this will probably not work too well after the first 6 months into your next year when someone new comes out that you don’t have.  You can find the full Microsoft comparison here and I’ve uploaded a current software matrix here.

Educational Licensing

Beyond the paid options from Microsoft, they also offer educational software for those of you that are students.  They have the standard program available through Microsoft Imagine.  For a homelab, the Window Server 2016 license would be a great place to start.  Many educational institutions have deals with Microsoft beyond Imagine.  You can search here to find out if your school has this set up.

Oracle Software

Oracle software is the reason this blog exists.  This has always been my primary technology to blog about.  So, if you are building a homelab for Oracle software, you might need some Oracle software!  I suggest two sites: Edelivery and the Oracle Proactive Support Blog for EPM and BI.

eDelivery

eDelivery, for lack of a much better word…sucks.  It’s difficult to find exactly what you want, but it does have everything you need, for free.  You will need to register for an Oracle account, but once you have one, you should be good to go.  You can find eDelivery here.

Patches

What about patches?  Patches are a little more tricky.  You still need an Oracle account, but generally you will need a support identifier.  This can be really simply like using your Oracle account at work or becoming a partner.  But, it still isn’t as free as the base software downloads.  To make matters worse, finding patches requires an advanced degree in Oracle Support Searching.  To make your search easier, Oracle has created a blog that provides updates about patches for EPM and BI software.  You can find this blog here.

Backup Software

Now that we have the foundation for our homelab software, what about backing things up?  We have a few options here.  The best part about this…they are all free.  Let’s start with my personal favorite:  Veeam.

Veeam Agent

Veeam is the most popular provider of virtual machine backup software out there.  But they do more than just virtual machine backup.  In fact, they have a free endpoint option.  This option backs up both your workstations and servers alike.  So if you have physical Windows or Linux Servers or Workstations, Veeam Agent is your best bet for free.  You can download is here.  Veeam Agent is great, but let’s be honest, the majority of our labs are virutalized.  So how do we back those up?

Veeam Availability

Veeam’s primary software set is around virtualization.  Veeam offers a variety of products that are built specifically for vmWare ESXi and Microsoft Hyper-V.  They have both a free option and a paid option, which is pretty nice.  The free option is Veeam Backup and Replication.  You can find this product here.  But the free option doesn’t do all of the fun things like scheduling.  You end up needing PowerShell to automate things.  Luckily, in addition to the free option, they also have something called an NFR option.

NFR stands for Not For Resale.  Essentially if you go fill out a form, you will get your very own copy of the full solution, Veeam Availability, for free.  This has all of the cool features around applications and scheduling.  It’s a truly enterprise-class tool for you homelab…for free.  You will have to get a new key each year, but it is totally worth the trouble.  You can fill out the form here.  One last thing…Veeam does require API access to vmWare.  So, you need to have a full license of ESXi for this to work.

Nakivo

I’m less familiar with Nakivo, but I wanted to mention another option for backup.  Nakivo, like Veeam, offers an NFR license.  You can fill out the form here.  My understanding is that Nakivo does not use the API, which allows it to work with the free version of ESXi.  This is a great benefit for those that doesn’t want to set up a custom solution with lots of moving pieces.

Conclusion

I hope this post can provide a little bit of clarity for the legitimate options out there for homelab software licensing.  I personally have a Microsoft Action Pack, VMUG Advantage, and Veeam Availability.  I plan to swap out my action pack for Visual Studio Professional when my renewal comes due, as I like having access to older versions of operating systems and SQL Server.  Happy homelabbing!


Build a Homelab Dashboard: Part 3, Organizr Continued

I know, I know…I promised InfluxDB would be my next post.  But, I’ve noticed that Organizr is not quite as straight forward to everyone as I thought.  So today we’ll be configuring Organizr and InfluxDB will wait until our next post.  Before we continue with configuring Organizr, let’s recap our series so far:

Configuring Organizr

Organizr is not always the most straight forward tool to configure.  Integration with things like Plex requires a bit of knowledge.  It doesn’t help of course that V2 is still in beta and the documentation doesn’t actually exist yet.  Let’s get started where we left off.  Let’s log in:

Adding a Homepage

Once logged in, we’re ready to start by adding the homepage to our tabs.  Click on Tab Editor:

Click on Tabs and you will notice that the homepage tab doesn’t appear on our tabs, so let’s move it around and make it active.  While we’re at it we’ll also make it the default.  We’ll get into why a little bit later.

Add a Tab

Now we can move on to adding the Plex tab.  Click the + sign:

Give the tab a name, in this case we’ll go with Plex.  Provide the URL to your Plex instance.  Choose an image, and click Add Tab:

Move the Plex tab up, make it active, and select the type of iFrame:

The different types are iFrame, Internal, or New Window.  Two of these are self-explanatory.  iFrame provides the URL directly inside of Organizr.  New Window opens a new tab in your browser.  The third, internal is for things like the homepage and settings that are built-in functionality in Organizr.  Many services works just fine in an iFrame, but some may experience issues.  For instance, pfSense doesn’t like being in an iFrame while FreeNAS doesn’t mind at all.  There are plenty of other options around groups and categories, but for now we’ll keep things simple.

The Homepage

Now that we know how to add tabs, how do we make our homepage look like this:

Getting Plex Tokens

What we see here is one of the main reasons you should consider Organizr.  This includes integration with Plex, Sonarr, and Radarr.  Let’s start with Plex.  Plex has an API that allows external applications like Organizr to integrate.  Configuring Plex isn’t all that straight forward unfortunately.  We’ll start by going back to our settings page and clicking on System Settings, then Single Sign-On, and finally Plex.

We are not trying to enable SSO right now, though you would likely be able to at the end of this guide with a single click.  We are just going to use this page as a facility to give us the Plex API Token and the Plex Machine Name.  These are required to enable homepage integration.  Click on Retrieve under Get Plex Token:

Enter your username and password for Plex and click Grab It:

Assuming you remember your username and password correctly, you should get a message saying that it was created and you can now click the x to go see it:

Now we can click on the little eye to see the Plex token.  Copy and paste this somewhere as we will need it later.

Next, we’ll click the retrieve button under Get Plex Machine:

Choose your Plex Machine that you want to integrate into Organizr:

The interesting part here is that it doesn’t actually say it did anything after you make the selection.  So just click the x and then we are ready to click the little eye again.  This time we will copy and paste the Plex Machine Name:

Plex Homepage Integration

Now that we have our Plex tokens, we can configure the homepage integration with Organizr.  Click on System Settings, then Tab Editor, followed by Homepage Items, and finally Plex:

Start by enabling Plex integration and then click on Connection:

Now enter our Plex URL and then refer back to your Plex tokens that you copied and pasted somewhere.  Click on Active Streams:

Enable active streams and click on Recent Items:

Enable recent items and click on Test Connection:

Be sure to click Save before finally clicking Test Connection:

Assuming everything went well, we should see a message in the bottom right corner that states:

Now let’s go take a look at what we get when we reload Organizr:

Calendar Integration

Another really cool aspect of Organizr is the consolidated calendar.  What does it consolidate?  Things like Radarr, Sonarr, and Lidarr.  It works much like the calendar on an iPhone or Android device in this way.  Today we’ll configure Organizr with Radarr and Sonarr.

Sonarr

We’ll start by going to our Sonarr site and clicking on Settings and then the General tab:

Once on the general tab, you should see your API key:

As with out Plex token, we’ll copy the API key and paste it somewhere while we go back into Organizr.  Back in Organizr, go to settings and click on Tab Editor, then Homepage Items, and finally Sonarr:


Click enable and then on the Connection tab:

Now enter your Sonarr URL, click Save, and click Test Connection:

Click Test Connection:

Assuming everything went well, we should see a message in the bottom right corner that states:

Now we can reload Organizr and check out our homepage:

Excellent!  We have a calendar that is linked to Sonarr.

Radarr

Radarr and Sonarr configure exactly the same, so I won’t bore you with the same screenshots with a different logo.

SABnzbd

The last Homepage item we will configure is SABnzbd.  Before we configure Organizr, we’ll go get our API key just like Plex, Sonarr, and Radarr.  Click on configuration:

Click on the General tab:

Now we can copy our API Key and paste it somewhere for later:

Back in Organizr, go to settings, click Tab Editor, Homepage Items, and finally SABNZBD:

Click enable and then click Connection:

Enter your SABnzbd URL, your API key, click Save, and then Test Connection:

Now click Test Connection:

Assuming everything went well, we should see a message in the bottom right corner that states:

Now let’s reload Organizr and take a look at our homepage:

Excellent!  Now we can move on to reordering everything the way we want it on the homepage.

Reordering

Go to settings and click on Tab Editor, then Homepage Order.  I prefer to have Plex above SABnzbd, so I drag SABnzbd just after Plex:

Be sure to click Save and it should look something like this:

Finally we can reload Organizr one last time and check it out:

Conclusion

And that’s that.  We have a barebones Organizr configuration completed and we are ready to move on to InfluxDB (for real this time)!  Happy dashboarding!


MDXDataCopy: Smart Push for On-Premise

If you attended my recent presentation at Kscope18, I covered this topic and provided a live demonstration of MDXDataCopy.  MDXDataCopy provides an excellent method for creating functionality similar to that of Smart Push in PBCS.  While my presentation has all of the code that you need to get started, not everyone likes getting things like this out of a PowerPoint and the PowerPoint doesn’t provide 100% of the context that delivering the presentation provides.

Smart Push

In case you have no idea what I’m talking about, Smart Push provides the ability to push data from one cube to another upon form save.  This means that I can do a push from BSO to an ASO reporting cube AND map the data at the same time.  You can find more information here provided in the Oracle PBCS docs.  This is one of the features we’ve been waiting for in On-Premise for a long time.  I’ve been fortunate enough to implement this functionality at a couple of client that can’t go to the cloud yet.  Let’s see how this is done.

MDXDataCopy

MDXDataCopy is one of the many, many functions included with Calculation Manager.  These are essentially CDF’s that are registered with Essbase.  As the name implies, it simply uses MDX queries pull data from the source cube and then map it into the target cube.  The cool part about this is that it works with ASO perfectly.  But, as with many things Oracle, especially on-premise, the documentation isn’t very good.  Before we can use MDXDataCopy, we first have some setup to do:

  • Generate a CalcMgr encyrption key
  • Encrypt your username using that key
  • Encrypt your password using that key

Please note that the encryption process we are going through is similar to what we do in MaxL, yet completely different and separate.  Why would we want all of our encryption to be consistent anyway?  Let’s get started with our encrypting.

Generate Encryption Key

As I mentioned earlier, this is not the same process that we use to encrypt usernames and passwords with MaxL, so go ahead and set your encrypted MaxL processes and ideas to the side before we get started.  Next, log into the server where Calculation Manager is installed.  For most of us, this will be where Foundation Services happens to also be installed.  First we’ll make sure that the Java bin folder is in the path, then we’ll change to our lib directory that contains calcmgrCmdLine.jar, and finally we’ll generate our key:

path e:\Oracle\Middleware\jdk160_35\bin
cd Oracle\Middleware\EPMSystem11R1\common\calcmgr\11.1.2.0\lib
java -jar calcmgrCmdLine.jar –gk

This should generate a key:


We’ll copy and paste that key so that we have a copy.  We’ll also need it for our next two commands.

Encrypt Your Username and Password

Now that we have our key, we should be ready to encrypt our username and then our password.  Here’s the command to encrypt using the key we just generated (obviously your key will be different):

java -jar calcmgrCmdLine.jar -encrypt -key HQMvim5GrSYox7S9bR8jSx admin
java -jar calcmgrCmdLine.jar -encrypt -key HQMvim5GrSYox7S9bR8jSx GetYourOwnPassword

This will produce two keys for us to again copy and paste somewhere so that we can reference them in our calculation script or business rule:

Now that we have everything we need from our calculation manager server, we can log out and continue on.

Vision

While not as popular as Sample Basic, the demo application that Hyperion Planning (and PBCS) comes with is great.  The application is named Vision and it comes with three BSO Plan Types ready to go.  What it doesn’t come with is an ASO Plan Type.  I won’t go through the steps here, but I basically created a new ASO Plan Type and added enough members to make my demonstration work.  Here are the important parts that we care about (the source and target cubes):

Now we need a form so that we have something to attach to.  I created two forms, one for the source data entry and one to test and verify that the data successfully copied to the target cube.  Our source BSO cube form looks like this:

Could it get more basic?  I think not.  And then for good measure, we have a matching form for the ASO target cube:

Still basic…exactly the same as our BSO form.  That’s it for changes to our Planning application for now.

Calculation Script

Now that we have our application ready, we can start by building a basic (I’m big on basic today) calculation script to get MDXDataCopy working.  Before we get to building the script, let’s take a look at the parameters for our function:

  • Key that we just generated
  • Username that we just encrypted
  • Password that we just encrypted
  • Source Essbase Application
  • Source Essbase Database
  • Target Essbase Application
  • Target Essbase Database
  • MDX column definition
  • MDX row definition
  • Source mapping
  • Target mapping
  • POV for any dimensions in the target, but not the source
  • Number of rows to commit
  • Log file path

Somewhere buried in that many parameters you might be able to find the meaning of life.  Let’s put this to practical use in our calculation script:

RUNJAVA com.hyperion.calcmgr.common.cdf.MDXDataCopy  
"HQMvim5GrSYox7S9bR8jSx"
"PnfoEFzjH4P37KrZiNCgd0TMRGSxWoFhbGFJLaP0K72mSoZMCz2ajF9TePp751Dv"
"D44Yplx+Mlj6P2XhGfwvIw4GWHQ5tWOytksR5bToq126xNoPYxWGe3KGlPd56oZ8"
"VisionM"
"Plan1"
"VMASO"
"VMASO"
"{[Jul]}"
"CrossJoin({[No Account]},CrossJoin({[FY16]},CrossJoin({[Forecast]},CrossJoin({[Working]},CrossJoin({[No Entity]},{[No Product]})))))"
""
""
""
"-1"
"e:\\mdxdatacopy.log";

Let’s run down the values used for our parameters:

  • HQMvim5GrSYox7S9bR8jSx (Key that we just generated)
  • PnfoEFzjH4P37KrZiNCgd0TMRGSxWoFhbGFJLaP0K72mSoZMCz2ajF9TePp751Dv (Username that we just encrypted)
  • D44Yplx+Mlj6P2XhGfwvIw4GWHQ5tWOytksR5bToq126xNoPYxWGe3KGlPd56oZ8 (Password that we just encrypted)
  • VisionM (Source Essbase Application)
  • Plan1 (Source Essbase Database)
  • VMASO (Target Essbase Application)
  • VMASO (Target Essbase Database)
  • {[Jul]} (MDX column definition, in this case just the single member from our form)
  • CrossJoin({[No Account]},CrossJoin({[FY16]},CrossJoin({[Forecast]},CrossJoin({[Working]},CrossJoin({[No Entity]},{[No Product]}))))) (MDX row definition, in this case it requires a series of nested crossjoin functions to ensure that all dimensions are represented in either the rows or the columns)
  • Blank (Source mapping which is left blank as the two cubes are exactly the same)
  • Also Blank (Target mapping which is left blank as the two cubes are exactly the same)
  • Also Blank (POV for any dimensions in the target, but not the source which is left blank as the two cubes are exactly the same)
  • -1 (Number of rows to commit which is this case is essentially set to commit everything all at once)
  • e:\\mdxdatacopy.log (Log file path where we will verify that the data copy actually executed)

The log file is of particular importance as the script will execute with success regardless of the actual result of the script.  This means that especially for testing purposes we need to check the file to verify that the copy actually occurred.  We’ll have to log into our Essbase server and open the file that we specified.  If everything went according to plan, it should look like this:

This gives us quite a bit of information:

  • The query that was generated based on our row and column specifications
  • The user that was used to execute the query
  • The source and target applications and databases
  • The rows to commit
  • The query and copy execution times
  • And the actual data that was copied

If you have an error, it will show up in this file as well.  We can see that our copy was successful.  For my demo at Kscope18, I just attached this calculation script to the form.  This works and shows us the data movement using the two forms.  Let’s go back to Vision and give it a go.

Back to Vision

The last step to making this fully functional is to attach our newly created calculation script to our form.  Notice that we’ve added the calculation script and set it to run on save:

Now we can test it out.  Let’s change our data:

Once we save the data, we should see it execute the script:

Now we can open our ASO form and we should see the same data:

The numbers match!  Let’s check the log file just to be safe:

The copy looks good here, as expected.  Our numbers did match after all.

Conclusion

Obviously this is a proof of concept.  To make this production ready, you would likely want to use a business rule so that you can get context from the form for your data copy.  There are however some limitations compared to PBCS.  For instance, I can get context for anything that is a variable or a form selection in the page, but I can’t get context from the grid itself.  So I need to know what my rows and columns are and hard-code that.  You could use some variables for some of this, but at the end of the day, you may just need a script or rule for each form that you with to enable Smart Push on.  Not exactly the most elegant solution, but not terrible either.  After all, how often do your forms really change?


Build a Homelab Dashboard: Part 2, Organizr

Welcome to Part 2 of the my soon to be one million part series about building your own Homelab Dashboard.  Today we will be laying the foundation for our dashboard using an open source piece of software name Organizr.  Before we dig any deeper into Organizr, let’s re-cap the series so far (yes, only two parts…so far):

What is Organizr?

So I know what you are thinking…in part 1 of this series I mentioned that I prefer the custom dashboard built by Gabisonfire and extended by me.  And while that is still true, I think that the broader audience would benefit more from the far larger set of functionality.  Additionally, the installer does a fantastic job of taking a base Linux install and bring along all of the dependencies without any real effort.  I’m always a fan of that.  But, what is Organizr?  Essentially, it is a pre-built homelab organization tool that is built on PHP and totally open source.  It has really great integration with many of the major media and server platforms out there.  Here’s a short list:

I also find that it just works with things like Grafana and really anything that works inside an iframe.  And if it doesn’t work in an iframe, just set it to pop out so that you can still have links to everything in one place.  I use it for these non-media related items:

  • Grafana
  • IPMI for all of my server (pop-out)
  • FreeNAS
  • pfSense (pop-out)
  • vCenter (pop-out)
  • My Hyperion instances (this is now officially a Hyperion post!)

Getting Started

As I mentioned earlier, the goal of this set of tutorials is to provide a soup-to-nuts solution. As a result, I’m going to assume that you need to install an operating system, configure that operating system, and then you will be ready to proceed.

Why am I making all of these assumptions? Mostly because that’s what I went through when I started this process. I’ve used Linux quite a bit over the years, but at the end of the day, I’m still a “Windows Guy.” In my industry, most of my work is done…in Windows. While a lot of this software will “work” in Windows, in most cases Windows is an afterthought, or beta…forever. So where do we start?

Installing Linux

We start at the very beginning with our operating system. I’ve worked with a lot of distributions over the years, but I always seem to end up on Debian. So I’ve decided to use Debian 9 (stretch). When I install, I use the net installer. You can find more information here:

https://www.debian.org/distrib/netinst

Or, you can just skip directly to downloading Debian 9.4 (netdist) here:

https://cdimage.debian.org/debian-cd/current/amd64/iso-cd/debian-9.4.0-amd64-netinst.iso

The reason I use the net installer is that it makes future package installer easier. It will configure the package manager during the installation and we’ll be ready to do basic configuration prior to installing Organizr. You can skip all of this if you already have a system you will be using or if you happen to know what you are doing…better than I do.

We start off by selecting the old-school installer:

Select your language:

Next select your location:

Select a keymap:

Enter your hostname:

Now, enter your domain name:

Enter your password for the root account:

Re-enter your password for the root account:

Enter the name of your non-administrative user:

Enter the username of your non-administrative user:

Select your time zone:

Use the guided partition using the entire disk (this is up to you, this is just the setting that I used):

Select the disk to partition (I only have one on the VM that I created):

Select a partitioning scheme (I went the new user route):

Write your changes to the disk(s):

Confirm that you REALLY want to make those changes:

Select the country you would like to use for your package manager mirror:

Select your favorite mirror:

Enter a proxy if you use one in your homelab:

Opt in…or out of the survey:

Select SSH and standard system utilities (this will give us a very basic install):

Next, select yes to install GRUB:

Select the device on which to install GRUB:

Let it go (my kids are really into Disney, so this will be stuck in my head for the remainder of this post):

You have officially installed Debian Linux. Throw some type of small celebration if this is a big deal for you…otherwise proceed to configuration.

Linux Configuration

Before we install Organizr, let’s get our Linux OS configured the way we want it. Basically we will install sudo, change our ssh configuration, and update our network settings. Once we do that, we’ll be ready to install Organizr.

Install sudo

Log into your system as root and issue this command:

apt-get install sudo -y

Which should look something like this:

Sudo

Rather than using our root username and password with SSH, we’ll grant the user that we created during our Linux installation access to sudo.  Sudo essentially executes a single command as root.  Here’s the command:

adduser brian sudo

This should look like this:

Update Network Configuration

Now we are ready to change our network settings. By default, everything is set to use DHCP. In my lab, everything has a static IP, so this system will be no different.  Issue this command:

nano /etc/network/interfaces

Change the adapter to auto (ens192), change from dhcp to static, and enter your network information (address, netmask, and gateway):

Hit control-o to save the changes and control-x to exit nano.

Now let’s restart our network services by issuing this command:

service networking restart

Oranizr Pre-Requisites

Organizr has very few pre-reqs. But, let’s get everything ready. I’m switching from the console now over to PuTTY. If you aren’t familiar with SSH, PuTTY is the easiest way to connect to your server. You can download it here:

https://www.chiark.greenend.org.uk/~sgtatham/putty/latest.html

Once you have PuTTY installed, you can connect to your new Linux box using our user account:

Now that we are connected, we can install git:

sudo apt-get install git

Notice that we are prompted for our password:

Now we should see this:


Installing Organizr

We can now finally begin the installation of Organizr. We’ll start by cloning the git repository:

sudo git clone https://github.com/elmerfdz/OrganizrInstaller /opt/OrganizrInstaller

Now we will go into the proper directory and start the installer:

cd /opt/OrganizrInstaller/ubuntu/oui
sudo bash ou_installer.sh

The installer will start up and we can select option 4, which will install everything:

The installer will now download everything and prompt you to continue:

Now we can select our version of Organizr (2 for the beta), which branch to install (2b, since this is a beta), a domain name and directory:

Finally the installer will download the beta and install everything. When prompted for the Nginx vhost template type… I just hit enter:

Assuming everything completed successfully, we’re all done:

Now we can visit our freshly created Organizr site to complete our configuration.

Organizr Configuration

Once again, assuming everything has gone well, we are ready to configure Oranizr. First we’ll select a license type. This is new and tells me that the Organizr team has their sites set on a wider audience in the future. Very interesting…and could be great for the project. So I selected Personal:

I entered my username, e-mail, and password:

Next, come up with a hash key and a registration password:

Name your database and select a location from the options or select your own:

Finish off your installation:

And there we have it:

Conclusion

That’s it!  Ogranizr is now ready to use.  This is of course beta, but it is a little prettier and a bit better administrative interface than V1.  Next up we can move on to laying the foundation for our statistics and reporting using InfluxDB.