Essbase Performance Series
Welcome to the sixth part in an on-going blog series about Essbase performance. Here’s a summary of the series so far:
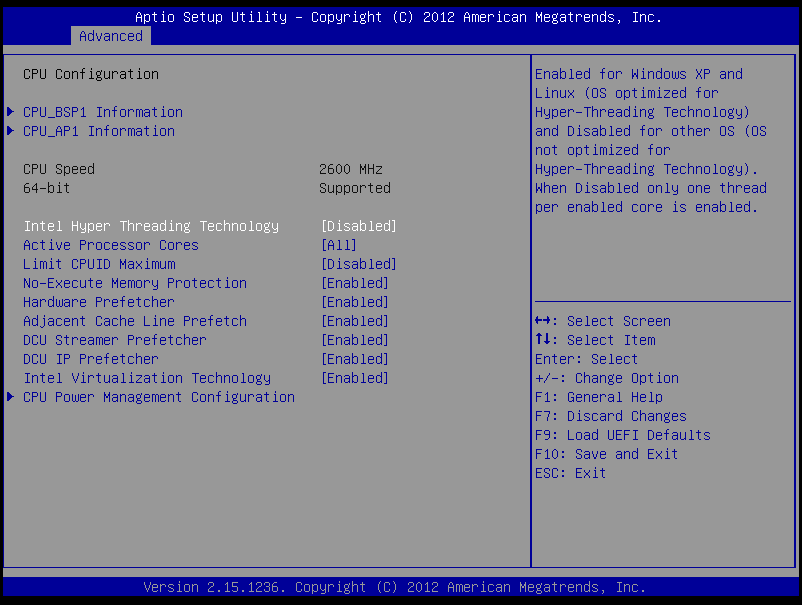
Now that EssBench is official, I’m ready to start sharing the benchmarks in Essbase and some explanation. Much of this was covered in my Kscope17 presentation, but if you download the PowerPoint, it lacks some context. My goal is to provide that context via my blog. We’ll start off with actual Essbase benchmarks around Hyper-Threading. For years I’ve always heard that Hyper-Threading was something you should always turn off. This normally lead to an argument with IT about how you even go about turning it off and if they would support turning it off. But before we too far, let’s talk about what Hyper-Threading is.
What is Hyper-Threading
Hyper-Threading is Intel’s implementation of a very old technology known as Simultaneous Multi-Threading (SMT). Essentially it allows each core of a processor to address two threads at once. The theory here is that you can make use of otherwise idle CPU time. The problem is that at the time of release in 2002 in the Pentium IV line, the operating system implementation of the technology was not great. Intel claimed up that it would increase performance, but it was very hit and miss depending on your application. At the time, it was considered a huge miss for Essbase. Eventually Intel dropped Hyper-Threading for the next generation of processors.
The Return of Hyper-Threading
With the release of the Xeon X5500 series processors, Intel re-introduced the technology. This is where it gets interesting. The technology this time around wasn’t nearly as bad. With the emergence of hypervisors and a massive shift in that direction, Hyper-Threading can actually provide a large benefit. In a system with 16 cores, now guests can address 32 threads. In fact, if you look at the Oracle documentation for their relational technology, they recommend leaving it on starting with the X5500 series of processors. With that knowledge, I decided to see how it would perform in Essbase.
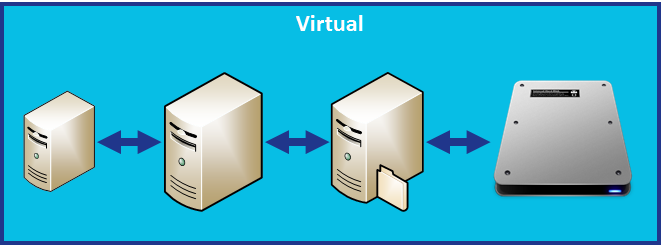
Testing Configuration
All testing is performed on a dedicated benchmarking server. This server changes software configurations between Windows and ESXi, but the hardware configuration is static:
One important note on hardware configuration. All of the benchmarks that have been run are using the same NVMe storage. This is our fastest storage option available, so this should ensure that we don’t skew the results with hardware limitations.
EssBench Application
The application used for all testing is EssBench. This application has the following characteristics:
- Dimensions
- Account (1025 members, 838 stored)
- Period (19 members, 14 stored)
- Years (6 members)
- Scenario (3 members)
- Version (4 members)
- Currency (3 members)
- Entity (8767 members, 8709 stored)
- Product (8639 members, 8639 stored)
- Data
- 8 Text files in native Essbase load format
- 1 Text file in comma separated format
- PowerShell Scripts
- Creates Log File
- Executes MaxL Commands
- MaxL Scripts
- Resets the cube
- Loads data (several rules)
- Aggs the cube
- Executes allocation
- Aggs the allocated data
- Executes currency conversion
- Restructures the database
- Executes the MaxL script three times
Testing Methodology
For these benchmarks to be meaningful, we need to be consistent in the way that they are executed. This particular set of benchmarks requires a configuration change at the system level, so it will be a little less straight forward than the future methodology. Here are the steps performed:
- With Hyper-Threading enabled, CALCPARALLEL and RESTRUCTURETHREADS were both set to 32. A new instance of EssBench was configured using the application name EssBch01. The EssBench process was run for this instance and the results collected. The three sets of results were averaged and put into the chart and graph below.
- With Hyper-Threading enabled, CALCPARALLEL and RESTRUCTURETHREADS were both set to 16. Another new instance of EssBench was configured using the application name EssBch06. The EssBench process was run and the results collected. The three sets of results were averaged and put into the chart and graph below.
- With Hyper-Threading enabled, CALCPARALLEL and RESTRUCTURETHREADS were both set to 8. Another new instance of EssBench was configured using the application name EssBch05. The EssBench process was run and the results collected. The three sets of results were averaged and put into the chart and graph below.
- Now we disable Hyper-Threading:
- With Hyper-Thread disabled, CALCPARALLEL and RESTRUCTURETHREADS were both set to 16. Another new instance of EssBench was configured using the application name EssBch02. The EssBench process was run and the results collected. The three sets of results were averaged and put into the chart and graph below.
- With Hyper-Thread disabled, CALCPARALLEL and RESTRUCTURETHREADS were both set to 8. Another new instance of EssBench was configured using the application name EssBch04. The EssBench process was run and the results collected. The three sets of results were averaged and put into the chart and graph below.
Essbase and Hyper-Threading
Let’s start by taking a look at each step of EssBench individually. I have some theories on each of these…but they could also just be the ramblings of a nerd recovering from Kscope17.
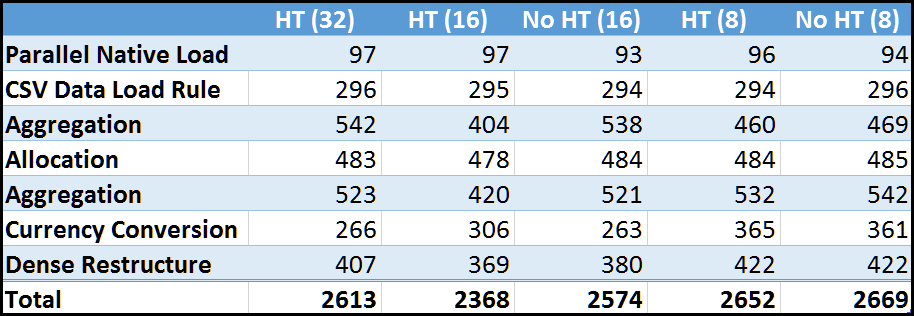
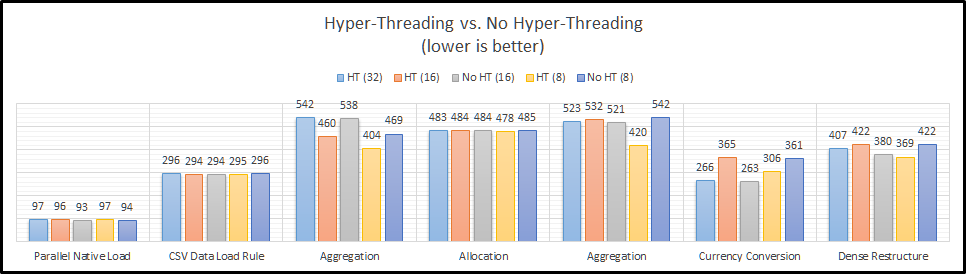
Parallel Native Load
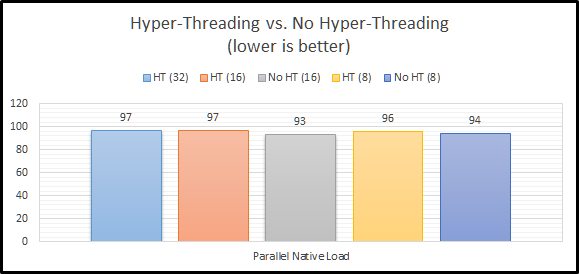
The parallel native load uses eight (8) text files and loads them into the cube in parallel. This means that the difference between our CALCPARALLEL and RESTRUCTURETHREADS should have no bearing on the results. The most interesting part about this benchmark is that all of the results are within 5% of each other. The first thing I notice is that they are not massively different when comparing Hyper-Threading enabled and Hyper-Threading disabled. Let’s move on to a single-threaded load.
CSV Data Load Rule
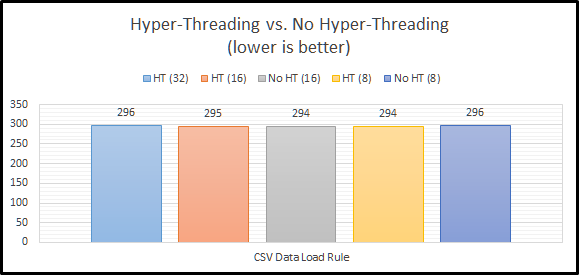
The next step in the benchmark simply loads a CSV file using an Essbase load rule. This is a single-threaded operation and again our settings outside of Hyper-Threading should have no bearing. And again, the most interesting thing about these results…they are within 1% of of each other. So far…Hyper-Threading doesn’t seem to make a difference either way. What about a command that can use all of our threads?
Aggregation
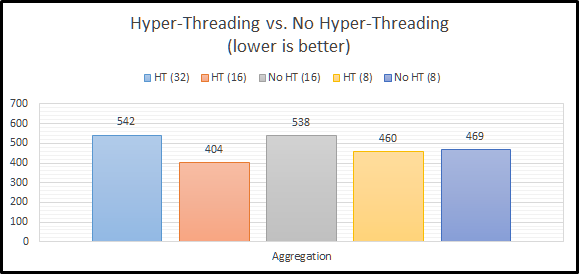
Now we have something to look at! We can clearly see that Hyper-Threading appears to massively improve performance for aggregations. This actually makes sense. With Hyper-Threading enabled, we have 32 logical cores for Essbase to use. With it disabled, we have 16. If we max out the settings for both, it would seem that we don’t have enough I/O performance to keep up. We can somewhat confirm this theory by looking at the results for CALCPARALLEL 8. When we attempt to only use half of our available CPU resources, there’s basically no difference in performance.
So is Hyper-Threading better, or worse for aggregation performance? The answer actually appears to be…indifferent. If we compare our two CALCPARALLEL 16 results, you might think that Hyper-Threading is what seems to be making things faster. But if we look at our setting of 8, we know that doesn’t make sense. Instead, I think what we are witnessing is the ability of Hyper-Threading to allow our system to really use cycles that otherwise go to waste. Our two settings that push our system to the max have the worst results. Essbase is basically taking all of the threads and keeping them to itself.
However, using 16 threads and having Hyper-Threading turned on seems to allow the operating system to properly use the additional 16 threads to good use for any overhead going on in the background. Basically, the un-used CPU time can be used if Hyper-Threading is turned on. The system seems to get overcome by Essbase and things slow down. So far, it looks our results tell us we should definitely use Hyper-Threading. They also indicate that Essbase doesn’t really seem to do well when it takes the entire server! If we consult the Essbase documentation, it actually suggests that CALCPARALLEL works best at 8.
Allocation
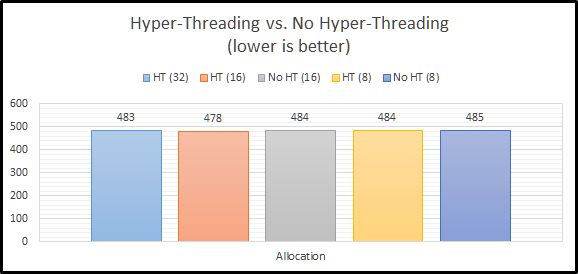
The allocation script actually ignores our setting for CALCPARALLEL altogether. How? It uses FIXPARALLEL. On a non-Exalytics system, FIXPARALLEL has a maximum setting of 8. We again see an instance of Hyper-Threading having no impact on performance. I believe that there are two reasons for this. First, we have plenty of I/O performance to keep up with 8 threads. Second, there is no need to use the un-used CPU time. There are plenty of CPU resources to go around. The good news here is that performance doesn’t go down at all. This again seems to support leaving Hyper-Threading enabled.
Aggregate Allocation
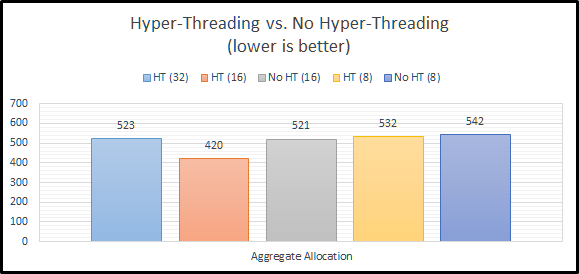
With our allocation calculation complete, the next step in EssBench is to aggregate that newly created data. These results should mirror the results from our initial allocation. And…they do for the most part. The results with CALCPARALLEL 8 are slower here. The results for CALCPARALLEL 16 are also slower. This is likely due to the additional random read I/O required to find all newly stored allocated data. The important thing to note here…CALCPARALLEL seems to love Hyper-Threading…as long as you have enough I/O performance, and you don’t eat the entire server.
Currency Conversion
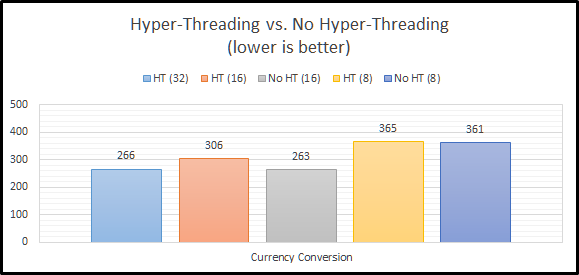
Our next step in the EssBench process…currency conversion. In this instance, it seems that the efficiency that Hyper-Threading gives us doesn’t actually help. Why? I’m guessing here, but I believe Essbase is getting more out of each core and I/O is not limiting performance here. If we look at CALCPARALLEL 8, the results are essentially the same. It seems that Essbase can actually use more of each processing core with the available I/O resources. So…does this mean that Hyper-Threading is actually slower here? On a per core basis…yes. But, we can achieve the same results with Hyper-Threading enabled, we just need to use more logical cores to do so.
Dense Restructure
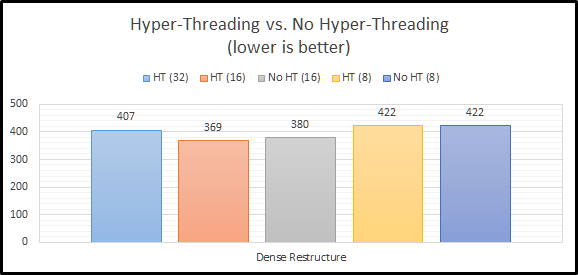
The last step in the EssBench benchmark is to force a dense restructure. This seems to bring us back to Essbase being somewhat Hyper-Threading indifferent. The Hyper-Threaded testing shows a very small gain, but nothing meaningful.
Total Benchmark Time
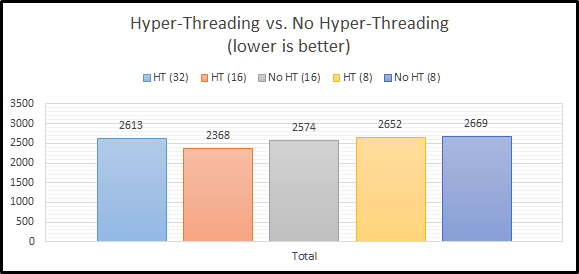
When we look at the final total results, we can see that Hyper-Threading overall performs better than or basically the same as no Hyper-Threading. This definitely goes against the long-standing recommendation to turn off Hyper-Threading.
Summarized Results
Let’s look at the all of the results in a grid:
And as a graph:
Conclusion
When I started down the path of EssBench and my Essbase Performance Series, I had a set of preconceived notions. Essbase admins should disable Hyper-Threading. Right? Testing on the other hand seems to completely disagree. The evidence is pretty clear that for this application, Hyper-Threading is at worst…a non-factor and at best…a benefit. This means that we no longer have to tell IT to disable Hyper-Threading. More importantly, this means that we don’t have to do something different and give IT a reason to question us.
The other important thing to take away from this…test your application. Try different settings on calculations to see what setting works the best for that calculation. Clearly we shouldn’t just rely on a single setting for CALCPARALLEL. If we wanted the absolute fastest performance, we would leave Hyper-Threading enabled and then use CALCPARALLEL set to 16 for everything but our currency conversion. For currency conversion we can save ourselves 40 seconds (over 10%) of our processing time by setting CALCPARALLEL to 32.