Thanks to a lot of help from /r/homelab, I’ve finally completed my first homelab dashboard. My dashboard has been built using a combination of tools that include, but are not limited to the following:
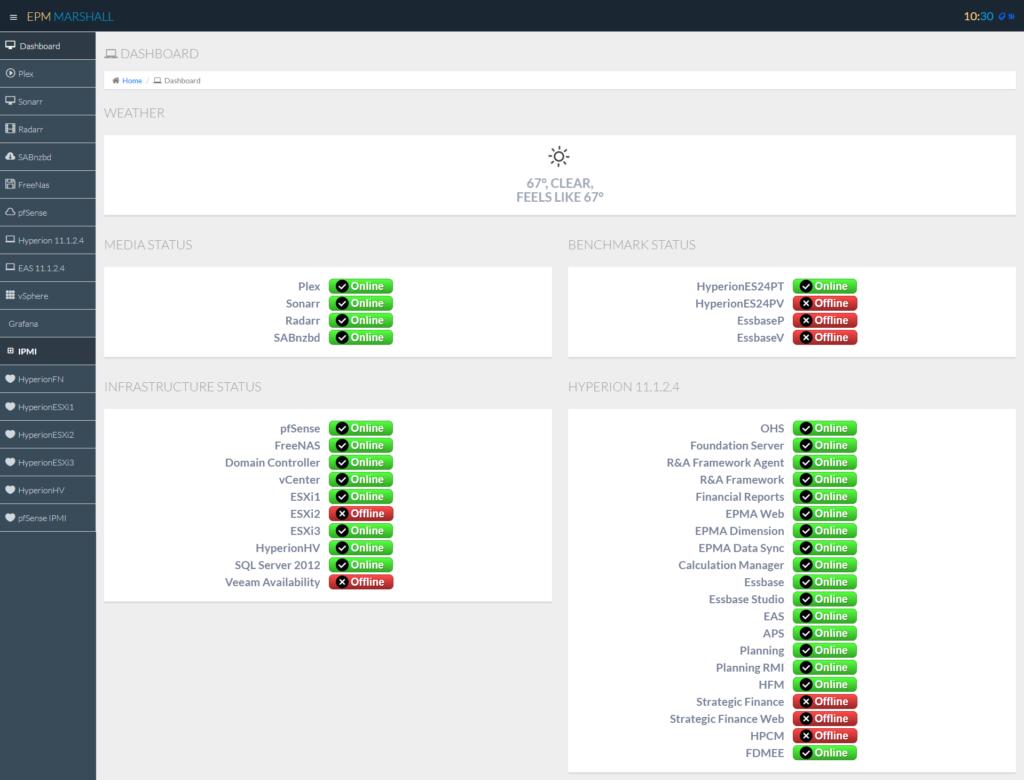
I started off with dashboard-q installed on top of the TurnKey LAMP Stack VM. This gave me a great foundation as Gabisonfire did a great job of putting together a dasbhoard on top of the Nice Admin template. I took that and modified it a bit to lay out the weather the way I wanted it and get it to look the way I wanted it to look on my phone and my computers. I then layered in my own status button for various services that I’d like to see a status of. This includes my Hyperion software and all of my various services like Radarr, Sonarr, SABnzbd, and others. So when I visit my dashboard, this is what I see:
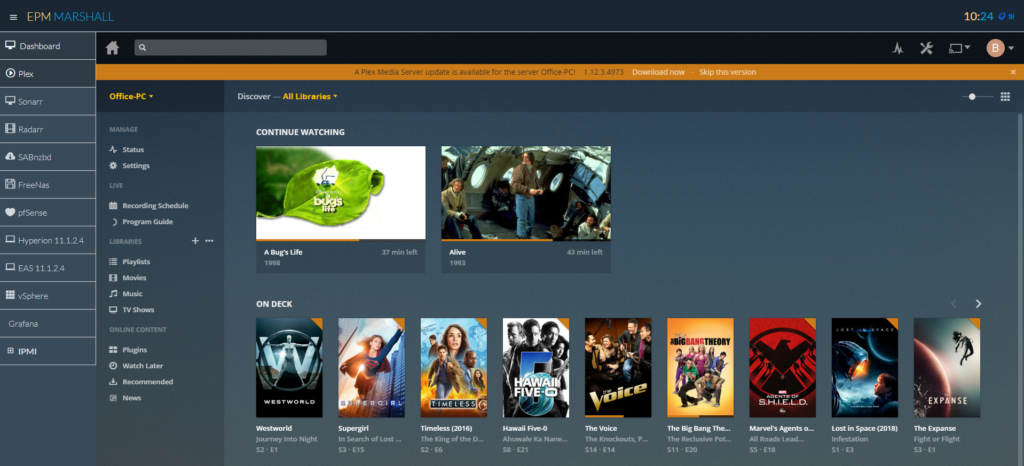
I created links using Gabisonfire’s category tool for each of my mainstays. First up is Plex:
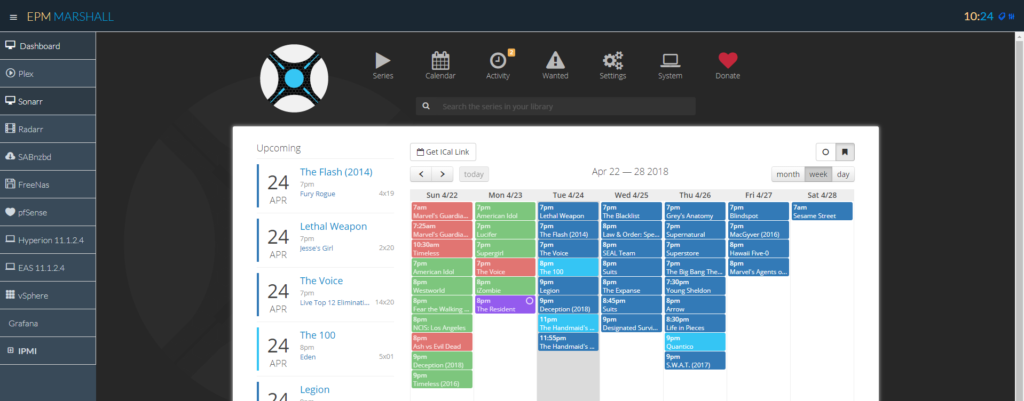
Next up is Sonarr:
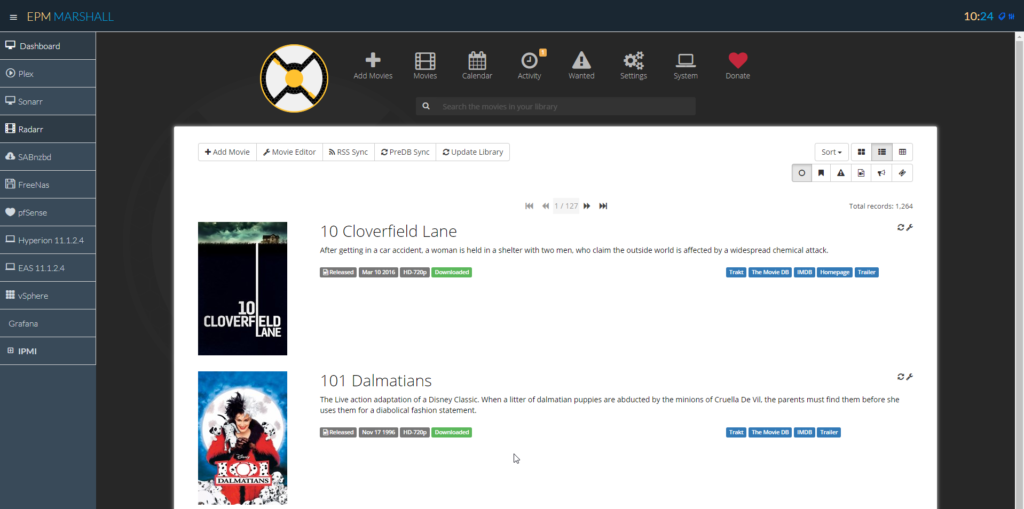
Followed by Radarr:
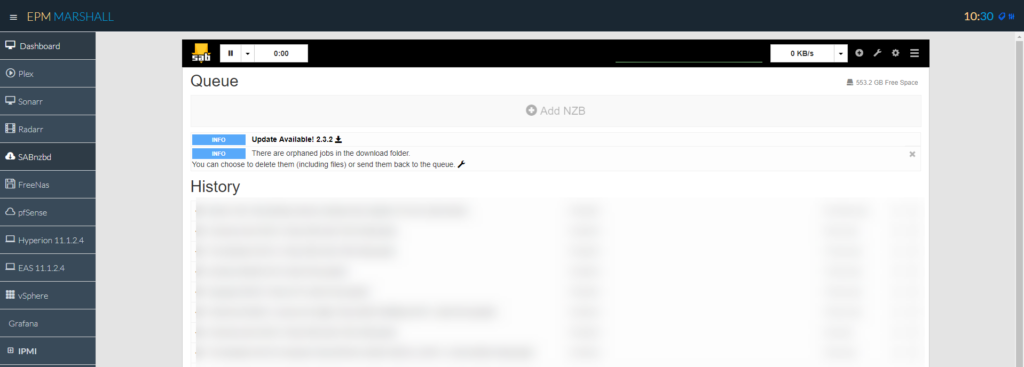
SABnzbd:
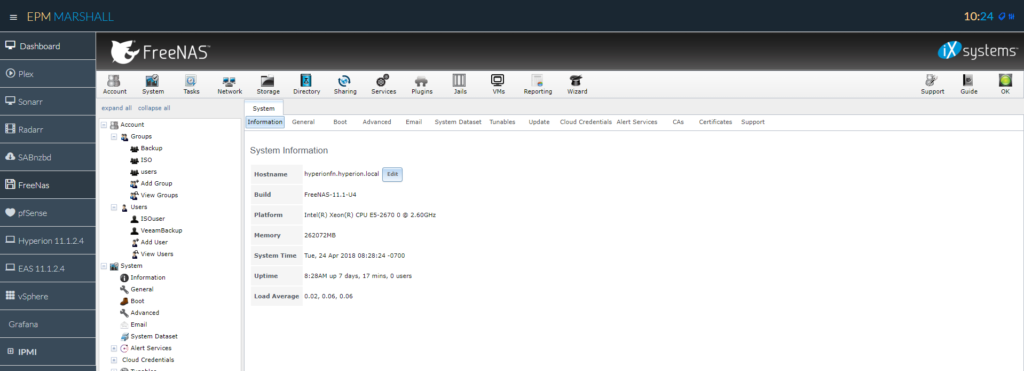
FreeNAS:
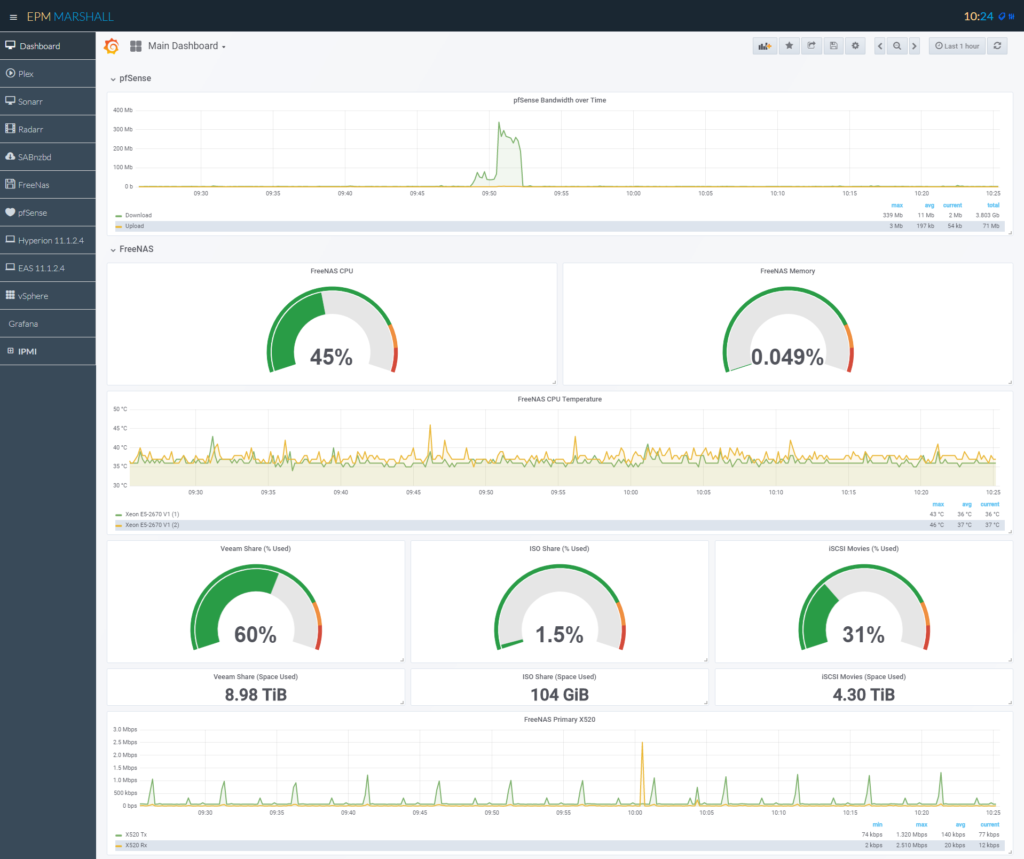
Finally…the one that took all of the work…Grafana:
This is built using Telegraf, InfluxDB, Graphite, and Grafana. I’m really happy with how it looks and integrates into my broader dashboard strategy. Thanks to everyone who helped me get this all configured, I’m really enjoying it!
